. 2013 May 23;153(5):1149-63.
doi: 10.1016/j.cell.2013.04.037. Epub 2013 May 9.

Transcriptional and epigenetic dynamics during specification of human embryonic stem cells

Affiliations

Transcriptional and epigenetic dynamics during specification of human embryonic stem cells

Casey A Gifford et al. Cell. .

Abstract

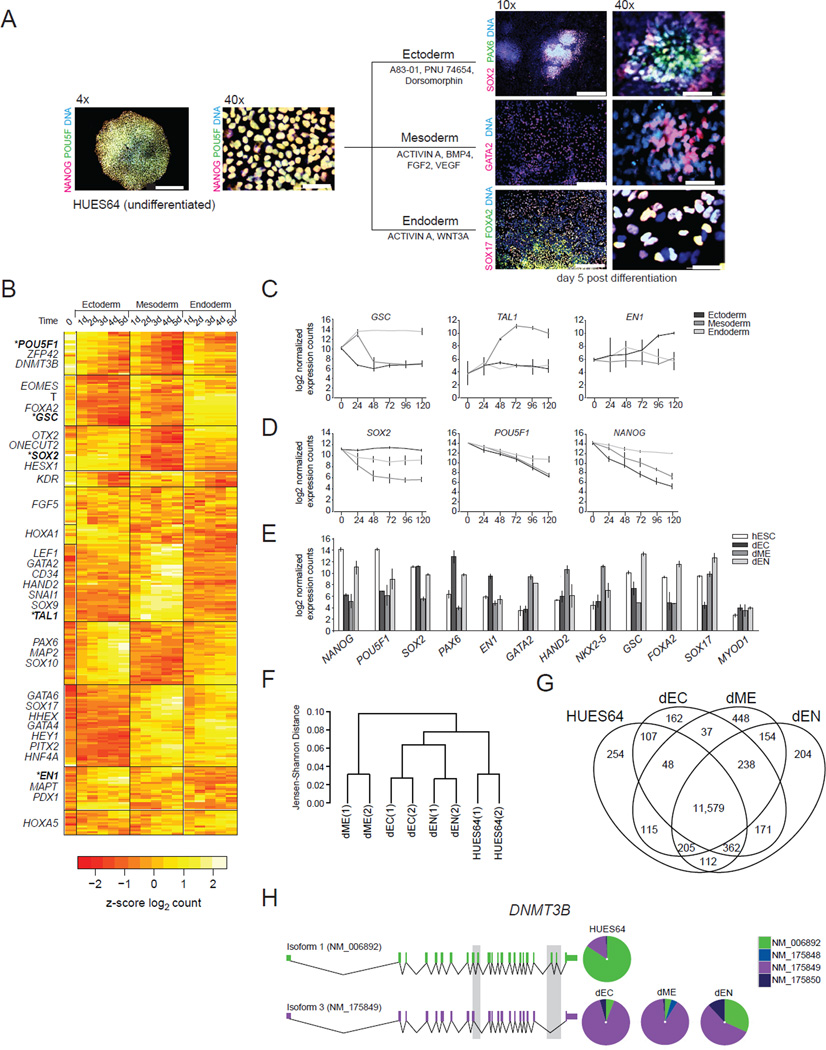
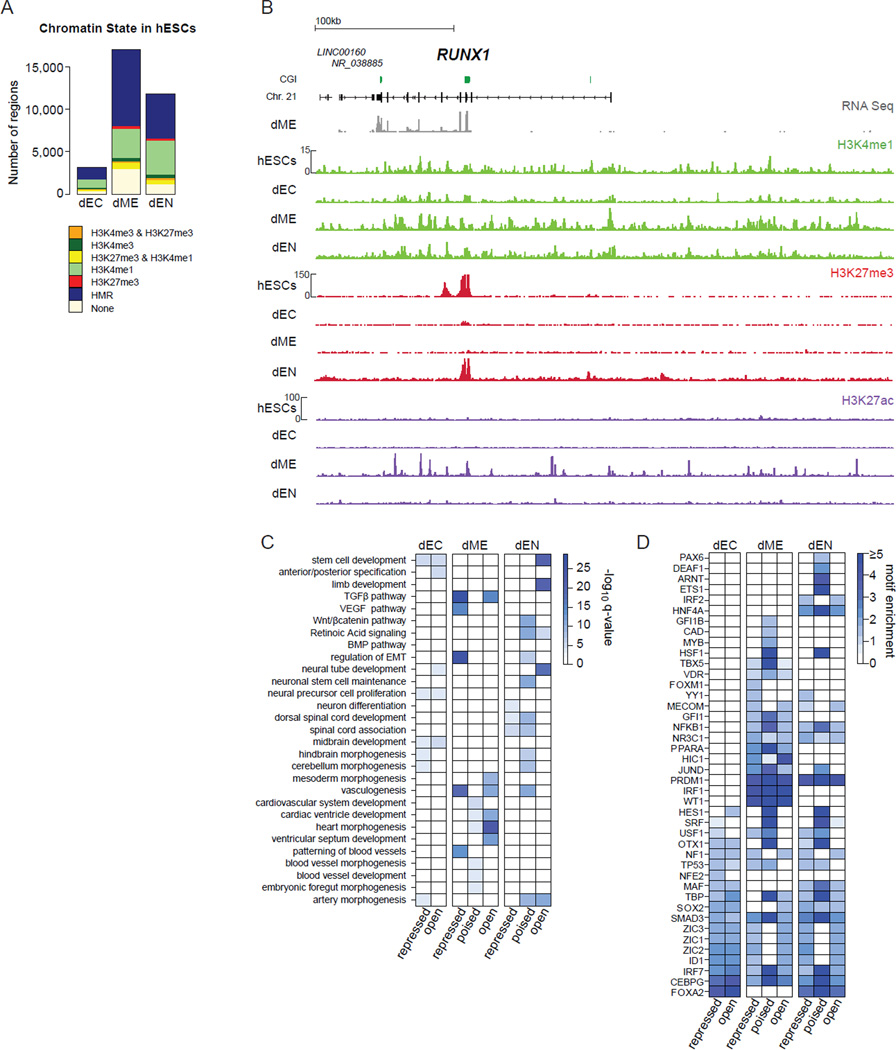
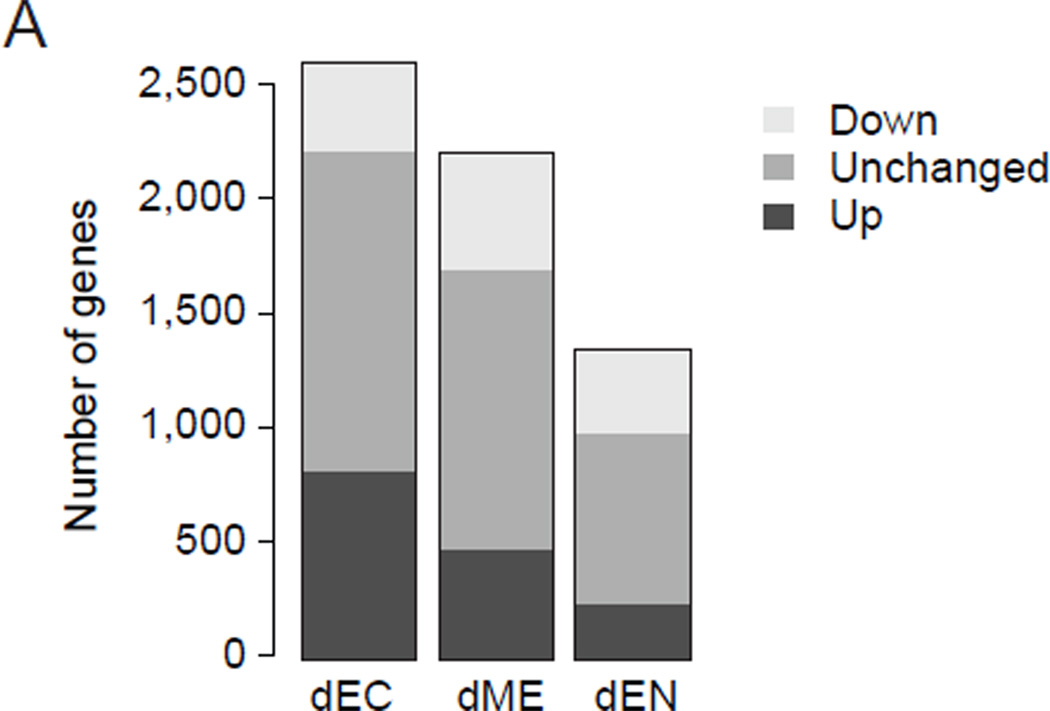
Differentiation of human embryonic stem cells (hESCs) provides a unique opportunity to study the regulatory mechanisms that facilitate cellular transitions in a human context. To that end, we performed comprehensive transcriptional and epigenetic profiling of populations derived through directed differentiation of hESCs representing each of the three embryonic germ layers. Integration of whole-genome bisulfite sequencing, chromatin immunoprecipitation sequencing, and RNA sequencing reveals unique events associated with specification toward each lineage. Lineage-specific dynamic alterations in DNA methylation and H3K4me1 are evident at putative distal regulatory elements that are frequently bound by pluripotency factors in the undifferentiated hESCs. In addition, we identified germ-layer-specific H3K27me3 enrichment at sites exhibiting high DNA methylation in the undifferentiated state. A better understanding of these initial specification events will facilitate identification of deficiencies in current approaches, leading to more faithful differentiation strategies as well as providing insights into the rewiring of human regulatory programs during cellular transitions.


Figures

Figure 1
Figure 1. Generation and Characterization of hESCs and hESC-Derived Cell Types
A. Left Low (4×) and high (40×) magnification overlaid immunofluorescent images of the undifferentiated human embryonic stem cell (hESC) line HUES64 stained with OCT4 (POU5F1) and NANOG antibodies. Right: Established directed (2-dimensional) differentiation conditions were used to generate representative populations of the three embryonic germ layers: hESC-derived ectoderm, hESC-derived mesoderm and hESC-derived endoderm. Cells were fixed and stained after 5 days of differentiation with the indicated antibodies. Representative overlaid images at low (10×) and high (40×) magnification are shown. DNA was stained with Hoechst 33342 in all images. Scale bars = 200µm (4×), 100 µm (10×) and 30 µm (40×). B. NanoString nCounter expression data (z-score log2 expression value of two biological replicates) for a time-course of in vitro differentiation using the conditions shown in panel A. 541 genes were profiled and 268 changing by more than 0.7 are displayed. Selected lineage-specific genes are shown on the left for each category that was identified based on hierarchical clustering (see Table S1 for all). The average log2 expression value of two biological replicates is displayed. Error bars represent one standard deviation (SD). C. The average log2 expression values of two biological replicates of lineage specific genes highlighted in panel B are shown. Error bars represent one SD. If no error is evident, SD < 0.5 log2 expression units. D. The average log2 expression values of two biological replicates of pluripotent genes highlighted in panel B are shown. Error bars represent one SD. If no error is evident, SD < 0.5 log2 expression units. E. NanoString nCounter profiling of FACS-isolated ectoderm (dEC), mesoderm (dME), and endoderm (dEN). Expression levels for MYOD1 (right) are included as a negative control. The average log2 expression value of two biological replicates is shown. Error bars represent one SD. If no error is evident, SD < 0.5 log2 expression units. F. Hierarchical clustering of global gene expression profiles as measured by strand-specific RNA-Seq for biological replicates of HUES64 and dEC, dME, and dEN is shown as a dendrogram. Pairwise distances between the replicates were measured using the Jensen-Shannon distance metric. G. Venn diagram illustrating unique and overlapping genes with expression (FPKM > 1) in HUES64 and the FACS-isolated directed differentiation conditions are shown. H. Differential splicing of DNMT3B in response to directed differentiation. Relative expression of isoforms 1 (NM_006892, green) and 3 (NM_175849, purple) as measured by RNA-Seq are shown on the right. See also Figure S1
Figure 2
Figure 2. Epigenetic Remodeling Is Lineage Specific During Directed Differentiation
A. WGBS (% methylation), ChIP-Seq (read count normalized to 10 million reads) and RNA-Seq (FPKM, read count normalized) for the undifferentiated hESC line HUES64 at three loci: NANOG (chr12:7,935,038-7,957,818), GSC (chr14:95,230,449-95,250,241), and H19 (chr11:2,015,282-2,027,359). CpG Islands (CGI) are indicated in green. B. Size distribution of genomic regions enriched for at least one of our 6 histone modifications in at least one cell type (hESC, dEC, dME, dEN) and/or classified as UMR or IMR in at least one cell type (n=297,617). C. Definition of epigenetic states used in this study and the genomic space occupied by these in the four cell types under study. D. Median CpG content of the genomic regions in distinct epigenetic states defined in panel C. E. Median expression level of epigenetic states used in this study (C) based on assignment of each region to the nearest RefSeq gene. Median was computed over the states in all four cell types and the corresponding expression profile. F. Epigenetic state map of regions enriched for one of five histone modifications in at least one cell type or classified as UMR/IMR in at least one cell type and changing its epigenetic state upon differentiation in at least one cell type (n=157,433). State definitions are listed in panel C. G. Regions bound by NANOG, OCT4, SOX2, as determined by ChIP-Seq and organized using the chromatin states in 2F. H. Enrichment of OCT4, SOX2 and NANOG within various classes of dynamic genomic regions changing upon differentiation of hESC, computed relative to all regions exhibiting the particular epigenetic state change in other cell types. Epigenetic dynamics are categorized into three major classes: repression (loss of H3K4me3 or H3K4me1 and acquisition of H3K27me3 or DNAme), maintenance of open chromatin marks (H3K4me3, H3K4me1, H3K27ac) and activation of previously repressed states. See also Figure S2.
Figure 3
Figure 3. Global DNA Methylation Dynamics – Gain of DNAme A
A. Hierarchical clustering of hESCs, hESC-derived populations (dEC, dME and dEN), human adult hippocampus and human adult liver based on mean DNAme levels of 1kb tiles across the human genome using Pearson Correlation Coefficient (PCC). Y-axis indicates sample distance in terms of 1 minus PCC. Red box indicates cell types interrogated in this study. B. Regions that significantly (p≤0.05) increase their DNAme levels by at least 0.1 between hESCs and the differentiated cell types. The color code indicates the DNAme state found in hESCs. Bottom: Genomic features associated with DMRs gaining DNAme in each of the differentiated cell types based on RefSeq gene annotation and de novo discovered promoters by RNA-Seq. C. The overlap of these differentially methylated regions (DMRs) that increase their DNAme level in the three hESC-derived populations. D. DNAme levels and RNA-Seq expression values of FOXA2 (chr20:22,559,343-22,571,189) in hESCs and differentiated cell types. The heat map below shows the DNAme values of individual CpGs within the highlighted region. The average DNAme value for the entire highlighted region is shown on the right in red. CpG islands (CGI) are shown as green bars. Expression values (FPKM) are displayed on the right. The arrows indicate two known TSSs. E. DNAme levels and OCT4, SOX2 and NANOG ChIP-Seq at the DBX1 locus (chr11:20,169,548-20,277,940). F. Distal elements (left) and Promoters (right) that gain DNAme separated by the changes in FPKM at associated genes. G. Chromatin state in hESCs at regions that gain DNAme during differentiation. Regions devoid of any detected chromatin marks are categorized according to their DNA methylation state in hESCs. See also Figure S3.
Figure 4
Figure 4. Global DNA Methylation Dynamics – Loss of DNAme
A. Regions that significantly (p≤0.05) decrease their DNAme levels by at least 0.1 between hESCs and the differentiated cell types. The color code indicates the DNAme state distribution in the differentiated cell types, revealing that most regions reside in an IMR state after they lost DNAme (left). Genomic features (bottom) associated with DMRs losing DNAme in each of the differentiated cell types based on RefSeq gene annotation and de novo discovered promoters by RNA-Seq. B. Venn diagram of identified DMRs that decrease their DNA methylation level between the three hESC-derived populations. C. DNAme at the POU3F1 locus (chr1:38,493,152-38,532,618). The heat map below shows the DNA methylation values of individual CpGs within the grey region. The average DNAme value for the entire highlighted region is shown on the right in red. CGIs are shown as green bars. Expression values (FPKM) are displayed on the right. D. Promoters (left) and distal elements (right) that gain DNAme separated by the changes in FPKM at associated genes. E. Chromatin state in differentiated cell types at regions that loose DNAme during differentiation. See also Figure S4.
Figure 5
Figure 5. H3K27ac Dynamics Demarcate Novel Lineage Specific Gene Regulatory Elements
A. Number of regions and associated epigenetic state distribution in hESCs of regions that are transitioning to H3K27ac in the three populations. B. Normalized ChIP-Seq tracks (H3K4me1, H3K27me3 and H3K27ac) for the RUNX1 region (chr21:36,091,108-36,746,447) with corresponding RNA-Seq data in dME. C. GO categories enriched in regions transitioning toH3K27ac in the cell type indicated on the right compared to hESCs as determined by GREAT analysis. Regions gaining H3K27ac were split up by state of origin in hESC into repressed (None, IMR, HMR, HK27me3), poised (H3K4me1/H3K27me3) and open (H3K4me3/H3K27me3, H3K4me3, H3K4me1). Color code indicates multiple testing adjusted q-value of category enrichment. D. TF motifs enriched in regions changing to H3K27ac in the cell type indicated on the right compared to hESCs. Color code indicates motif enrichment score incorporating total enrichment over background as well as differential expression of the corresponding transcription factor in the respective cell type. Regions were split up by state of origin in hESCs similar to panel C. For each region class, the eight highest-ranking motifs are shown. See also Figure S5.
Figure 6
Figure 6. Characterization of H3K4me1 Dynamics at Putative Distal Regulatory Elements
A. Overlap of regions gaining H3K4me1 in the three differentiated populations relative to hESCs. B. Genomic distribution of all regions gaining H3K4me1 compared to hESCs in at least one of the three differentiated populations. C. Tissue signature enrichment levels of genes assigned to regions specifically gaining H3K4me1 in the differentiated populations indicated on the bottom. For tissue signature definitions, see Extended Experimental Procedures. D. Number and distribution of gene expression changes of genes assigned to regions gaining H3K4me1 in the differentiated populations. Associated genes were classified as either being up/down- regulated or unchanged relative to hESCs. E. Normalized ChIP-Seq tracks (H3K4me1 and H3K36me3) for the LMO2 locus (Chr.11:33,865,134-33,977,858). Read counts on y-axis are normalized 10 million reads for each cell type. CGIs are indicated in green. F. Normalized ChIP-seq tracks (H3K4me1 and H3K36me3) for the CYP2A6/CYP2A7 region (Chr19: 41,347,260-41,395,599). Read counts on y-axis are normalized 10 million reads for each cell type. CGIs are indicated in green. G. Normalized motif enrichment scores for the top 15 motifs enriched in regions specifically transitioning to H3K4me1 in the differentiated cell type indicated on the bottom. Motif highlighted in red corresponds to a TF that is upregulated at the next stage (hepatoblast) of endoderm differentiation while motifs highlighted in green are specifically upregulated in dEN but downregulated at the dHep stage. H. Gene expression levels of genes assigned to regions gaining H3K4me1 specifically in dEN compared to hESC and being upregulated in dEN but not hepatoblast (top). Gene expression levels of genes being upregulated between dEN and dHep (but not between hESC & dEN) and gaining H3K4me1 in dEN are shown on the bottom. I. Fraction of regions changing to H3K4me1 in dEN and being enriched for H3K27ac in human liver (n=1,346). See also Figure S6.
Figure 7
Figure 7. DNAme to H3K27me switch and FOXA2 Binding
A. Distribution of genomic features associated with region gaining H3K27me3 (n=22,643) upon differentiation to any of the three hESC derived cell types compared to hESC. B. CpG content distribution of regions gaining H3K27me3 upon differentiation. For reference, the CpG content distribution of CpG islands is shown. C. Epigenetic state distribution in hESC, dEC and dME of regions that gain H3K27me3 in the dEN population compared to hESC. D. Binding profile of FOXA2 in dEN (n=357), OCT4 (n=32), SOX2 (n=12) and NANOG (n=124) in hESC across regions that gain H3K27me3 in dEN upon differentiation. E. Composite plot of median normalized tag counts (RPKM) of regions bound by FOXA2 in dEN and gaining H3K27me3 in dEN compared to hESC (n=369). F. Normalized H3K27me3 and H3K4me3 ChIP-seq tracks for hESCs, dEN and human adult liver tissue at the ALB locus (chr4:74,257,882-74,377,753). Black bars (bottom) indicate TF binding of OCT4, SOX2 or NANOG in hESCs. Read counts on y-axis are normalized to 10 million reads. G. Distribution of methylation levels of regions bound by FOXA2 and gaining H3K27me3 in dEN. DNAme information is depicted for hESC and dEN WGBS datasets and two biological replicates of FOXA2 ChIP-Bisulfite experiments in dEN (n=369). H. Gene expression profile of genes upregulated at the hepatoblast stage relative to dEN that are associated with regions bound by FOXA2 and gaining H3K27me3 in dEN (n=50). I. Fraction of regions gaining H3K27me3 in dEN and being enriched for H3K27ac in human liver (n=192). See also Figure S7.

References

    1. Ahlgren U, Pfaff SL, Jessell TM, Edlund T, Edlund H. Independent requirement for ISL1 in formation of pancreatic mesenchyme and islet cells. Nature. 1997;385:257–260. - PubMed
    1. Bock C, Beerman I, Lien WH, Smith ZD, Gu H, Boyle P, Gnirke A, Fuchs E, Rossi DJ, Meissner A. DNA methylation dynamics during in vivo differentiation of blood and skin stem cells. Mol Cell. 2012;47:633–647. - PMC - PubMed
    1. Bock C, Kiskinis E, Verstappen G, Gu H, Boulting G, Smith ZD, Ziller M, Croft GF, Amoroso MW, Oakley DH, et al. Reference Maps of human ES and iPS cell variation enable high-throughput characterization of pluripotent cell lines. Cell. 2011;144:439–452. - PMC - PubMed
    1. Brinkman AB, Gu H, Bartels SJ, Zhang Y, Matarese F, Simmer F, Marks H, Bock C, Gnirke A, Meissner A, et al. Sequential ChIP-bisulfite sequencing enables direct genome-scale investigation of chromatin and DNA methylation cross-talk. Genome Res. 2012;22:1128–1138. - PMC - PubMed
    1. Cai CL, Liang X, Shi Y, Chu PH, Pfaff SL, Chen J, Evans S. Isl1 identifies a cardiac progenitor population that proliferates prior to differentiation and contributes a majority of cells to the heart. Dev Cell. 2003;5:877–889. - PMC - PubMed

Publication types