. 2013 May 23;153(5):1134-48.
doi: 10.1016/j.cell.2013.04.022. Epub 2013 May 9.

Epigenomic analysis of multilineage differentiation of human embryonic stem cells

Affiliations

Epigenomic analysis of multilineage differentiation of human embryonic stem cells

Wei Xie et al. Cell. .

Abstract

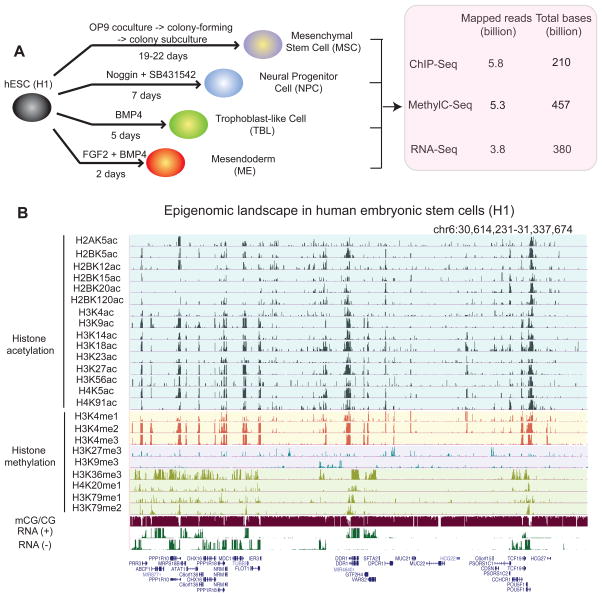
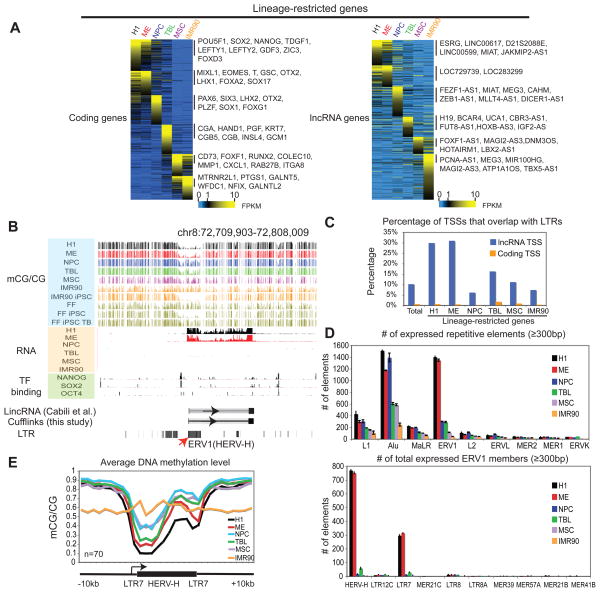
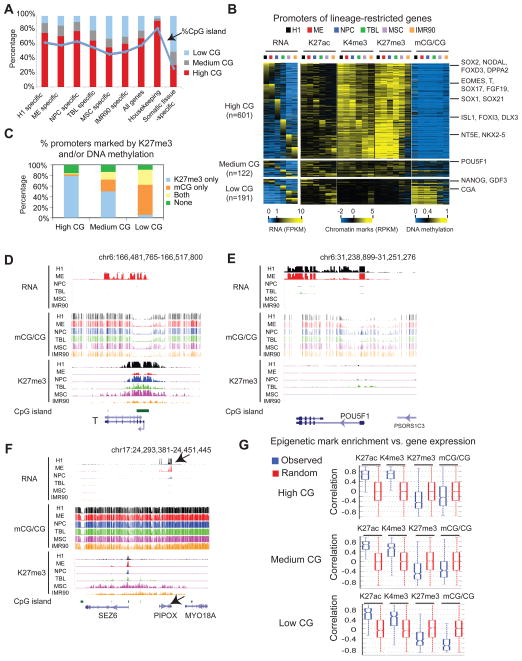
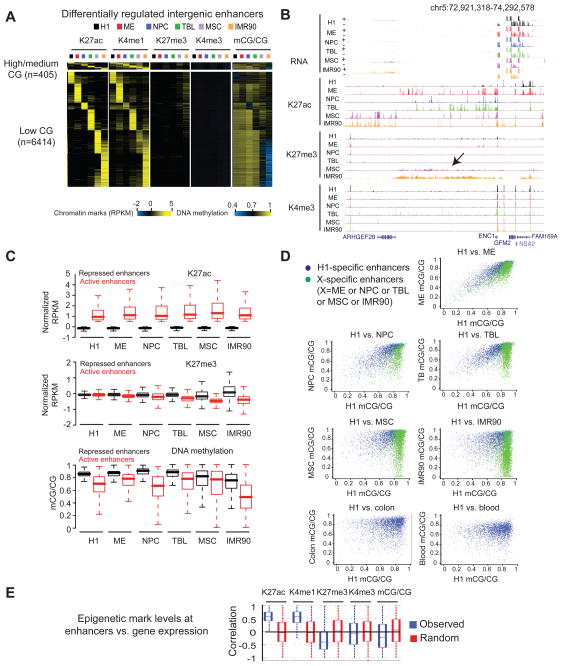
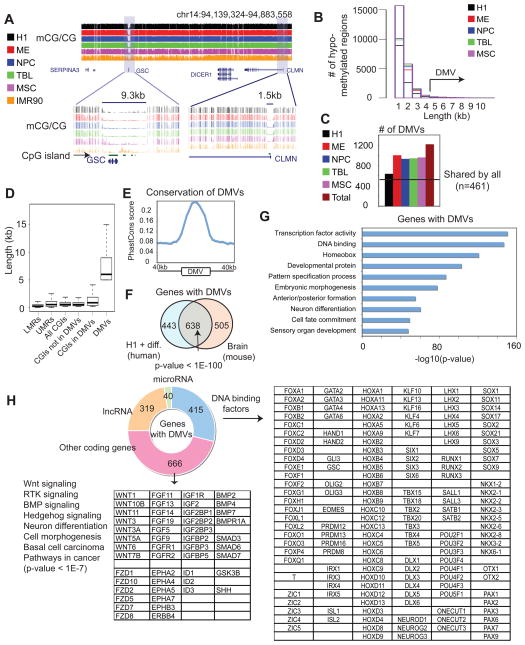
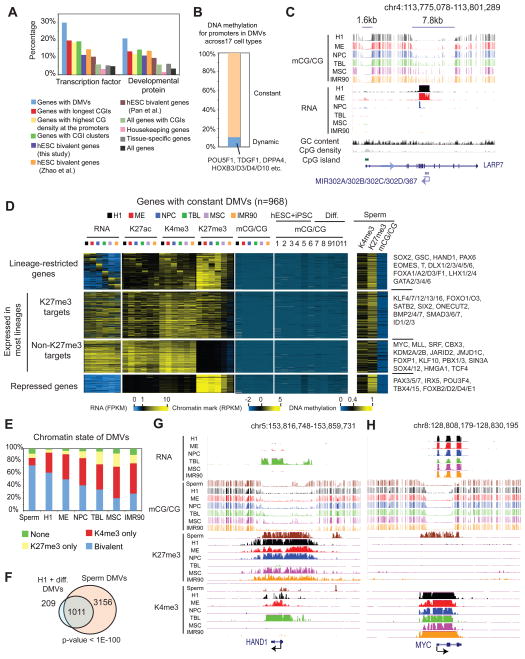
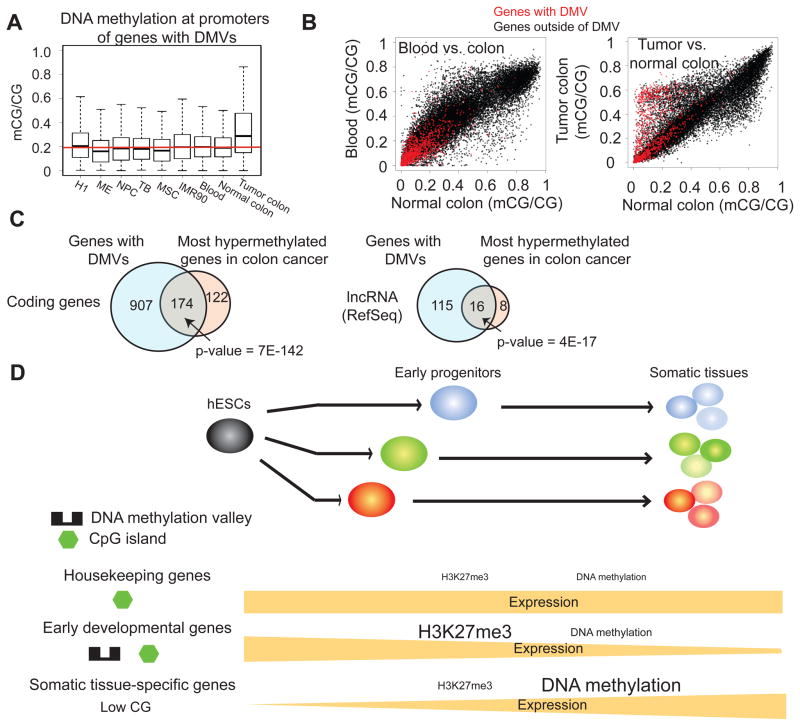
Epigenetic mechanisms have been proposed to play crucial roles in mammalian development, but their precise functions are only partially understood. To investigate epigenetic regulation of embryonic development, we differentiated human embryonic stem cells into mesendoderm, neural progenitor cells, trophoblast-like cells, and mesenchymal stem cells and systematically characterized DNA methylation, chromatin modifications, and the transcriptome in each lineage. We found that promoters that are active in early developmental stages tend to be CG rich and mainly engage H3K27me3 upon silencing in nonexpressing lineages. By contrast, promoters for genes expressed preferentially at later stages are often CG poor and primarily employ DNA methylation upon repression. Interestingly, the early developmental regulatory genes are often located in large genomic domains that are generally devoid of DNA methylation in most lineages, which we termed DNA methylation valleys (DMVs). Our results suggest that distinct epigenetic mechanisms regulate early and late stages of ES cell differentiation.


Figures

Figure 1
Figure 1. Generation of comprehensive epigenome reference maps for hESCs and four hESC derived lineages
(A) Schematic of hESC differentiation procedures and a summary of the epigenomic datasets produced in this study. (B) A snapshot of the UCSC genome browser shows the DNA methylation level (mCG/CG), RNA-Seq reads (+, Watson strand; -, Crick strand), and ChIP-Seq reads (RPKM) of 24 chromatin marks in H1. See also Figure S1.
Figure 2
Figure 2. Identification of lineage-restricted transcripts in H1 and the H1-derived cells
(A) Heatmaps showing the expression levels of lineage-restricted coding genes (left) and lncRNA genes (right). Genes are organized by the lineage in which their expression is enriched. Note that certain genes (such as SOX2) can be expressed in more than one cell type. (B) The levels of DNA methylation, RNA, as well as the binding of NANOG, SOX2, and POU5F1, are shown around an annotated lincRNA gene with the promoter overlapping a HERV-H element. (C) The percentages of TSSs that overlap with LTRs are shown for coding genes (yellow) and lncRNA genes (blue) for all genes (total) or lineage-restricted genes. (D) The numbers of expressed (FPKM≥1), mappable repetitive elements are shown in each cell type for various repeat classes (top) or subclasses of ERV1 (bottom). Data are represented as mean +/− standard deviation based on two replicates of RNA-Seq. (E) The average DNA methylation level in each cell type is shown for a subset of H1-specific HERV-H elements. See also Figure S2.
Figure 3
Figure 3. Epigenetic regulation of promoters for lineage-restricted genes
(A) Bar graphs showing the percentages of promoters in the high, medium and low CG classes for genes that are enriched in each cell type, all RefSeq genes, housekeeping genes, and somatic tissue-specific genes identified in (Zhu et al., 2008). The percentages of promoters that contain CGIs are also shown (blue line). (B) Heatmaps showing the average levels of RNA, H3K27ac, H3K4me3, H3K27me3 and DNA methylation for promoters of lineage-restricted genes. Histone modifications, TSS +/− 2kb; DNA methylation, TSS +/− 200bp; promoter CG density: TSS +/− 500bp. (C) Bar graphs showing the percentages of promoters that are marked by DNA methylation or K27me3 in at least one cell type. (D–F) The levels of RNA, DNA methylation, and K27me3 are shown for the locus containing T (D), POU5F1 (E), or PIPOX (F). PIPOX (black arrow) is a low CG promoter-containing gene located in a K27me3 domain in MSCs and IMR90 where it is also repressed. (G) The distribution of Pearson correlation coefficients between gene expression level and the levels of various histone modifications or DNA methylation at promoters. See also Figure S3.
Figure 4
Figure 4. Epigenetic regulation of lineage-restricted enhancers
(A) Heatmaps showing the average levels of H3K27ac, H3K4me1, H3K4me3, H3K27me3, and DNA methylation around the centers of lineage-restricted enhancers. Histone modifications, enhancer center +/− 2kb; DNA methylation, enhancer center +/− 500bp; CG density, enhancer center +/− 500bp. (B) The epigenetic landscape at an intergenic locus showing a low level of H3K27me3 and absence of H3K27ac in MSC and IMR90. (C) Boxplots showing the levels of H3K27ac (top), H3K27me3 (middle) and DNA methylation (bottom) at active and repressed enhancers in each cell type. (D) Scatterplots showing the levels of DNA methylation in each cell type at H1-specific enhancers (blue) and differentiated cell-specific enhancers (green). In the last two panels, colon- and blood-specific enhancer information (green dots) is not available in (Berman et al., 2012; Li et al., 2010). (E) Boxplots showing the distribution of Pearson correlation coefficients between the levels of various histone modifications or DNA methylation at enhancers and the expression level of their potential target genes. See also Figure S4.
Figure 5
Figure 5. Genes within DNA Methylation Valleys (DMVs) are strongly enriched for transcription factors and developmental genes
(A) DNA methylation levels for a DMV (GSC) and a nearby typical UMR (CLMN) are shown. (B) Histograms showing the distribution of the lengths of hypomethylated regions in various cell types. (C) The numbers of DMVs found in various cell types. The horizontal line indicates the number of DMVs shared by all cell types. (D) The distribution of lengths of various genomic elements as indicated. (E) The average conservation level (PhastCons scores) around DMVs. (F) A Venn diagram showing the overlap of genes with DMVs in humans (H1 and its derived cells) and in mice (frontal cortex). (G) Gene ontology analysis results for DMV genes in H1 and the H1-derived cells. (H) A breakdown of the types of DMV genes in H1 and the H1-derived cells, with examples shown in the tables. See also Figure S5.
Figure 6
Figure 6. DMVs largely remain hypomethylated in sperm and many terminally differentiated cell types
(A) Percentages of genes that belong to various gene ontology groups are shown as bar graphs for coding genes in DMVs (n = 1,081), genes with longest CGIs (n = 1,081), genes with the highest promoter CG densities (n=1,081), genes with CGI clusters (n = 1,019), hESC bivalent genes as defined in this study (n=2,401) or in previous studies (Zhao et al., 2007, n=1,797 after gene symbol conversion; Pan et al., 2007, n=3,301 after gene symbol conversion), all RefSeq genes, housekeeping genes (n = 3,140) and somatic tissue-specific genes (n = 885) as defined in (Zhu et al., 2008). (B) A bar graph showing the percentages of promoters in DMVs that demonstrate dynamic DNA methylation (mCG/CG ≥ 0.4 in any cell types) or constant DNA methylation (mCG/CG < 0.4 in any cell types). (C) The levels of DNA methylation and RNA are shown near mir-302A/302B/302C/302D/367. A transcript, likely the hosting transcript for this microRNA gene cluster, is observed mainly in H1 and ME (only - strand RNA reads are shown for simplicity). (D) Heatmaps showing RNA, H3K27ac, H3K4me3, H3K27me3 and DNA methylation levels for promoters of genes with DMVs within various categories. The levels of DNA methylation in additional 11 cell types and sperm, as well as the levels of H3K4me3 and H3K27me3 in sperm, are also shown. 1, hESC H9; 2–4, foreskin fibroblast (FF)-derived iPSC lines (19.11,6.9,19.7); 5, adipose-derived stem (ADS) cell iPSCs; 6, FF iPSC-derived trophoblast-like cells; 7, ADS; 8, ADS-derived adipocytes; 9, FF (Lister et al., 2011); 10, PMBC (blood) (Li et al., 2010); 11, colon tissue (Berman et al., 2012). (E) The chromatin state (presence of H3K4me3 and/or H3K27me3) of DMVs is shown for various cell types. (F) The overlap of DMVs is shown between those in H1 and its derived cells, and those in sperm. (G–H) The epigenetic landscape is shown for the DMV associated with the gene HAND1 (G) or MYC (H). See also Figure S6.
Figure 7
Figure 7. DMVs are preferentially methylated in cancer
(A) Boxplots showing the distribution of the DNA methylation levels at promoters in DMVs for various cell types. (B) Scatterplots showing the DNA methylation levels at promoters between colon and blood (left), and normal and tumor colon (right). Red, promoters with DMVs; black, all other promoters in the genome. (C) Venn diagrams showing the overlaps between genes of which the promoters are hypermethylated in colon cancer (ΔmCG≥0.4, at least 10 CGs covered) and genes with DMVs, for coding genes (left) and lncRNA genes (right). (D) A model for three classes of promoters with distinct sequence features and epigenetic regulation mechanisms in cell differentiation. See the main text for details and also Figure S7.

Similar articles

Cited by

References

    1. Anokye-Danso F, Trivedi CM, Juhr D, Gupta M, Cui Z, Tian Y, Zhang Y, Yang W, Gruber PJ, Epstein JA, et al. Highly efficient miRNA-mediated reprogramming of mouse and human somatic cells to pluripotency. Cell Stem Cell. 2011;8:376–388. - PMC - PubMed
    1. Barrera LO, Li Z, Smith AD, Arden KC, Cavenee WK, Zhang MQ, Green RD, Ren B. Genome-wide mapping and analysis of active promoters in mouse embryonic stem cells and adult organs. Genome Res. 2008;18:46–59. - PMC - PubMed
    1. Berman BP, Weisenberger DJ, Aman JF, Hinoue T, Ramjan Z, Liu Y, Noushmehr H, Lange CP, van Dijk CM, Tollenaar RA, et al. Regions of focal DNA hypermethylation and long-range hypomethylation in colorectal cancer coincide with nuclear lamina-associated domains. Nat Genet. 2012;44:40–46. - PMC - PubMed
    1. Bernardo AS, Faial T, Gardner L, Niakan KK, Ortmann D, Senner CE, Callery EM, Trotter MW, Hemberger M, Smith JC, et al. BRACHYURY and CDX2 mediate BMP-induced differentiation of human and mouse pluripotent stem cells into embryonic and extraembryonic lineages. Cell Stem Cell. 2011;9:144–155. - PMC - PubMed
    1. Bernstein BE, Mikkelsen TS, Xie X, Kamal M, Huebert DJ, Cuff J, Fry B, Meissner A, Wernig M, Plath K, et al. A bivalent chromatin structure marks key developmental genes in embryonic stem cells. Cell. 2006;125:315–326. - PubMed

Publication types