. 2013 May 20;23(10):890-4.
doi: 10.1016/j.cub.2013.04.012. Epub 2013 May 9.

Locomotion controls spatial integration in mouse visual cortex

Affiliations

Locomotion controls spatial integration in mouse visual cortex

Aslı Ayaz et al. Curr Biol. .

Abstract

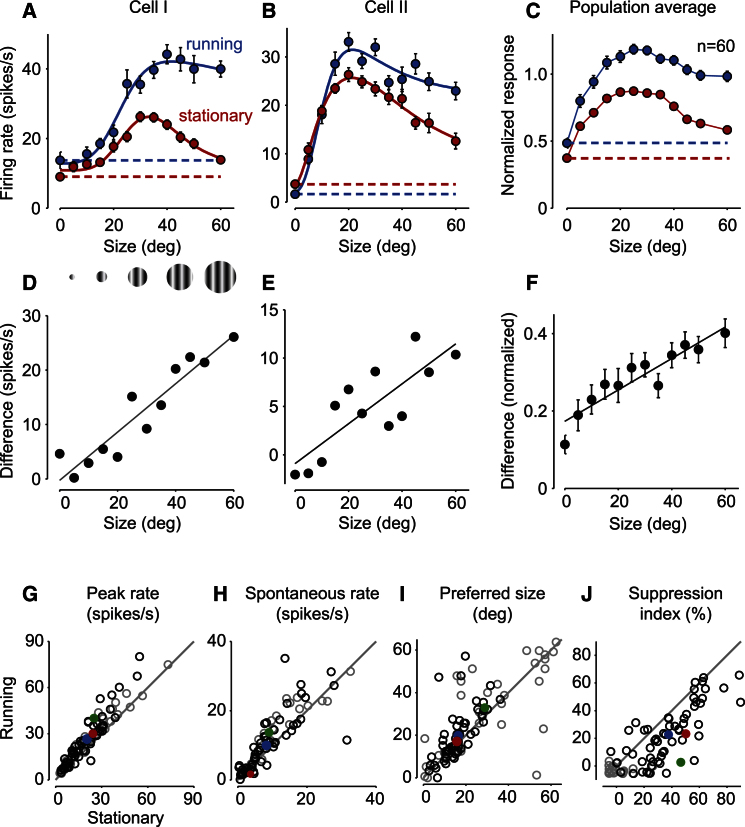
Growing evidence indicates that responses in sensory cortex are modulated by factors beyond direct sensory stimulation. In primary visual cortex (V1), for instance, responses increase with locomotion. Here we show that this increase is accompanied by a profound change in spatial integration. We recorded from V1 neurons in head-fixed mice placed on a spherical treadmill. We characterized spatial integration and found that the responses of most neurons were suppressed by large stimuli. As in primates, this surround suppression increased with stimulus contrast. These effects were captured by a divisive normalization model, where the numerator originates from a central region driving the neuron and the denominator originates from a larger suppressive field. We then studied the effects of locomotion and found that it markedly reduced surround suppression, allowing V1 neurons to integrate over larger regions of visual space. Locomotion had two main effects: it increased spontaneous activity, and it weakened the suppressive signals mediating normalization, relative to the driving signals. We conclude that a fundamental aspect of visual processing, spatial integration, is controlled by an apparently unrelated factor, locomotion. This control might operate through the mechanisms that are in place to deliver surround suppression.


Figures

None
Graphical abstract
Figure 1
Figure 1
Size Tuning in Mouse V1 (A) Head-fixed mice were placed on an air-suspended spherical treadmill. Extracellular activity was recorded using multilaminar silicon probes while drifting gratings were presented on the screen. (B) Size tuning response of an example neuron. Curve shows the model fit, and error bars are the SEM. P indicates preferred stimulus size, where response reaches 95% of peak response. RP and RL indicate responses at preferred and largest stimulus sizes. (C) Population suppression indices for all recorded neurons (n = 89). Black dots indicate size-tuned neurons, which have positive suppression indices. Red dot is the neuron in (B); green dot indicates the neuron in Figure 2A.
Figure 2
Figure 2
Locomotion Reduces Surround Suppression (A and B) Response of two example neurons while the mouse was stationary (red) and during locomotion (blue). Dotted lines show the spontaneous firing rate. Error bars represent SEM. (C) The average responses of size-tuned neurons (n = 60), normalized to the peak stationary response. Red and blue indicate stationary and running. Error bars represent SEM. (D) The effect of locomotion grows with stimulus size. Ordinate/vertical axis indicates the difference between responses during locomotion and when stationary, for the example cell in (A). Diagonal line indicates linear fit. (E and F) Differences between responses at locomotive and stationary states for the example cell in (B) and for the average responses in (C) (R2 = 0.86). Error bars represent SEM. (G) Effect of locomotion on peak firing rate for all recorded neurons. Open black circles represent size-tuned neurons (n = 60); blue circle indicates the mean of these values. Gray circles represent neurons that were not size tuned (suppression index < 0, n = 29). Green and red dots indicate the example neurons in (A) and (B). (H–J) Locomotion effects on spontaneous firing rate (H), preferred stimulus size (I), and suppression index (J). See also Figures S1–S4.
Figure 3
Figure 3
Divisive Normalization Describes Surround Suppression in Mouse V1 (A) Divisive model of spatial integration. (B) Percentage of the explainable variance captured by the model. First bin indicates values < 0, and the last bin indicates values > 100%. Ordinate/vertical axis is number of cells. (C) Responses of an example neuron to changes in stimulus size for three stimulus contrasts (light gray: 10%, darker gray: 50%, black: 100%). Curves are fits of the model. Error bars in (C)–(F) indicate SEM. (D) A different view of the same data, expressed as a function of stimulus contrast for three stimulus diameters (light gray: 13°, darker gray: 28°, black: 60°). Curves represent the fits of the same model as in (C). (E and F) Same as (C) and (D), for a different example neuron. Stimulus diameters in (F) are 20° (light gray), 35° (darker gray), and 60° (black). (G and H) Effects of contrast on spatial integration. As the stimulus contrast increases from 10% (abscissa) to 100% (ordinate/vertical axis), the suppression index increases (G) and the preferred stimulus size decreases (H). Red dots represent two example neurons presented in (C and D) and (E and F). Blue dots are the mean values for the whole population of cells.
Figure 4
Figure 4
Effects of Locomotion on Divisive Normalization (A and B) Responses of an example neuron as a function of stimulus diameter (abscissa) and contrast (light gray: 10%, darker gray: 50%, black: 100%) while the mouse is stationary (A) and during locomotion (B). Error bars represent SEM. Curves are the fits of the divisive normalization model in which only three parameters are free to change with locomotion: the baseline firing rate R0, the strength of the driving field RD, and the strength of the suppressive field RS. For this example neuron, locomotion increased baseline activity R0 from 11 to 24 and decreased the strength of both driving field (RD from 77 to 33) and suppressive field (RS from 133 to 17). The remaining parameters were fixed (σD = 7.3, σS = 364, δ = 0.0, m = 1.2, n = 1.0 for this neuron). (C) Locomotion increased the baseline firing rate. Each point corresponds to a cell, and the gray level indicates confidence in the estimates. In (C)–(F), gray scale bars show log SD of each parameter estimate, and histograms indicate the distribution of log differences. (D–F) Similar to (C), effects of locomotion are shown on the strength of the suppressive field RS (D), the strength of the driving field RD (E), and the ratio between the two (F). (G–L) Distribution of fixed parameters across population, showing the extent of the driving Gaussian (σD) (G), the suppressive Gaussian (σS) (H), the ratio of these two (I), the miscentering parameter (δ) (J), and the exponents m and n (K) and (L).

References

    1. Ghazanfar A.A., Schroeder C.E. Is neocortex essentially multisensory? Trends Cogn. Sci. 2006;10:278–285. - PubMed
    1. Matyas F., Sreenivasan V., Marbach F., Wacongne C., Barsy B., Mateo C., Aronoff R., Petersen C.C. Motor control by sensory cortex. Science. 2010;330:1240–1243. - PubMed
    1. Shuler M.G., Bear M.F. Reward timing in the primary visual cortex. Science. 2006;311:1606–1609. - PubMed
    1. Reynolds J.H., Heeger D.J. The normalization model of attention. Neuron. 2009;61:168–185. - PMC - PubMed
    1. Roberts M., Delicato L.S., Herrero J., Gieselmann M.A., Thiele A. Attention alters spatial integration in macaque V1 in an eccentricity-dependent manner. Nat. Neurosci. 2007;10:1483–1491. - PMC - PubMed

Publication types

LinkOut - more resources