. 2013 Jul 19:1522:38-58.
doi: 10.1016/j.brainres.2013.04.057. Epub 2013 May 7.

Identification and distribution of projections from monoaminergic and cholinergic nuclei to functionally differentiated subregions of prefrontal cortex

Affiliations

Identification and distribution of projections from monoaminergic and cholinergic nuclei to functionally differentiated subregions of prefrontal cortex

Daniel J Chandler et al. Brain Res. .

Abstract

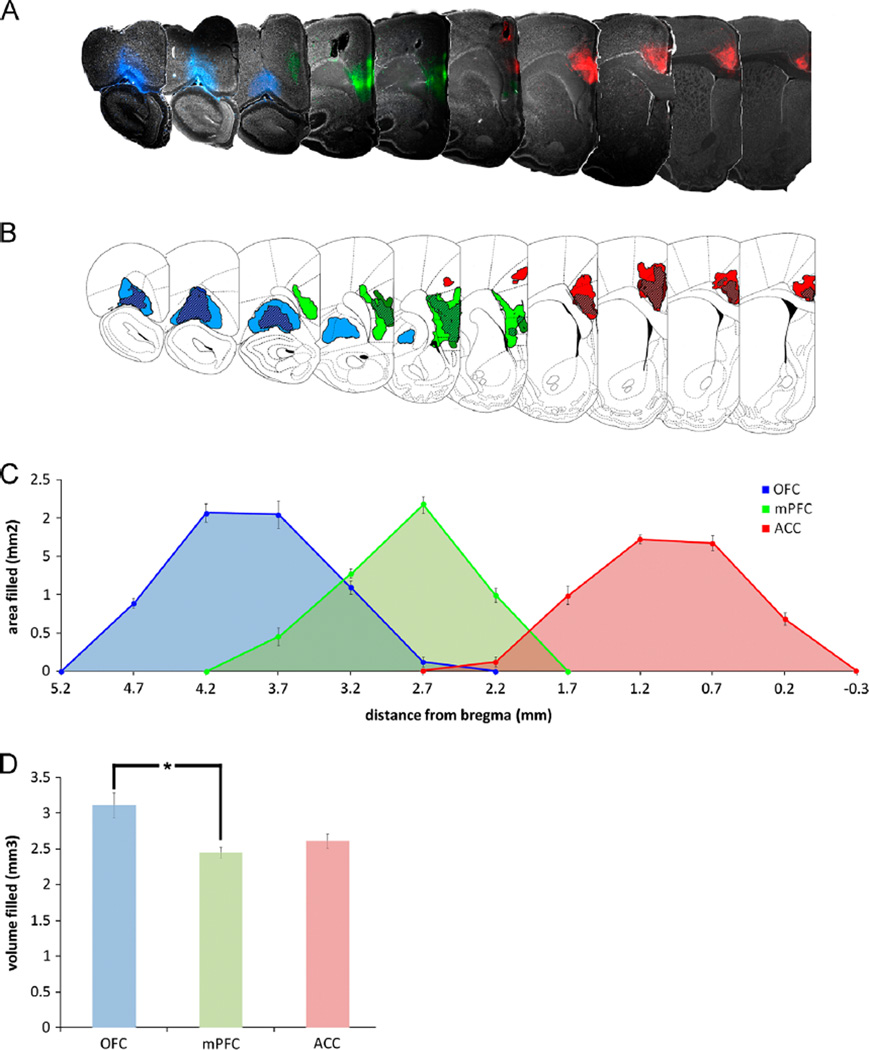
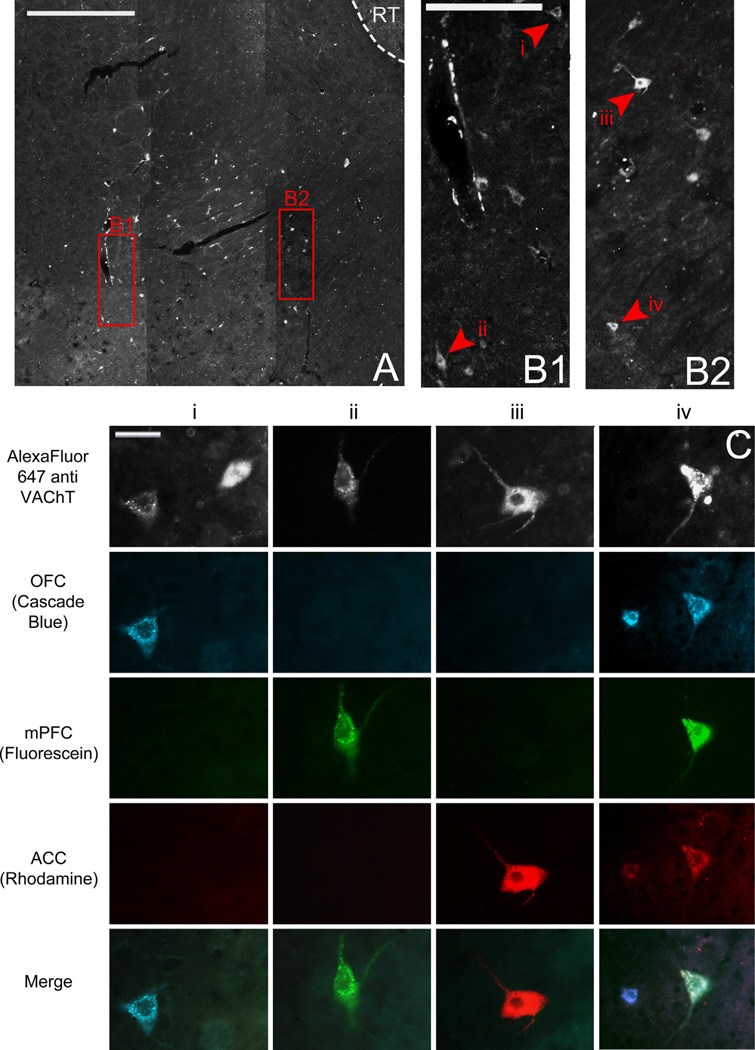
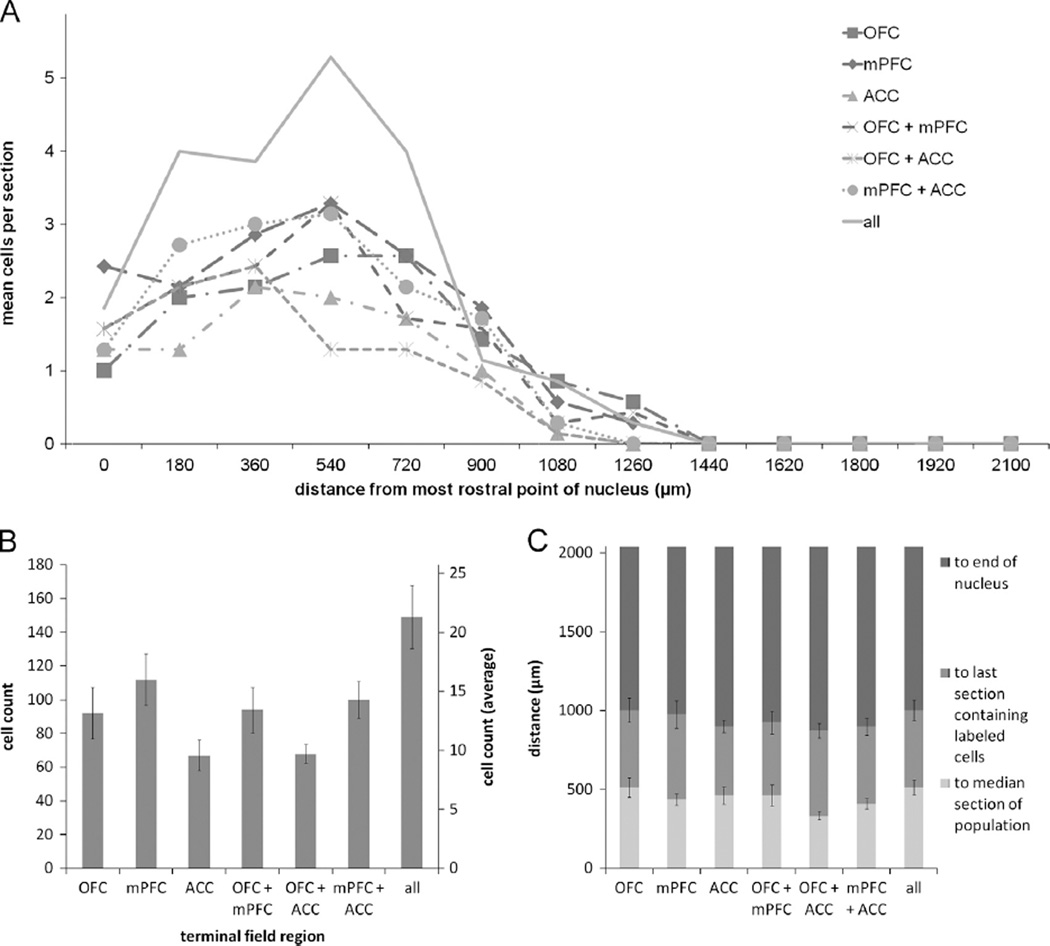
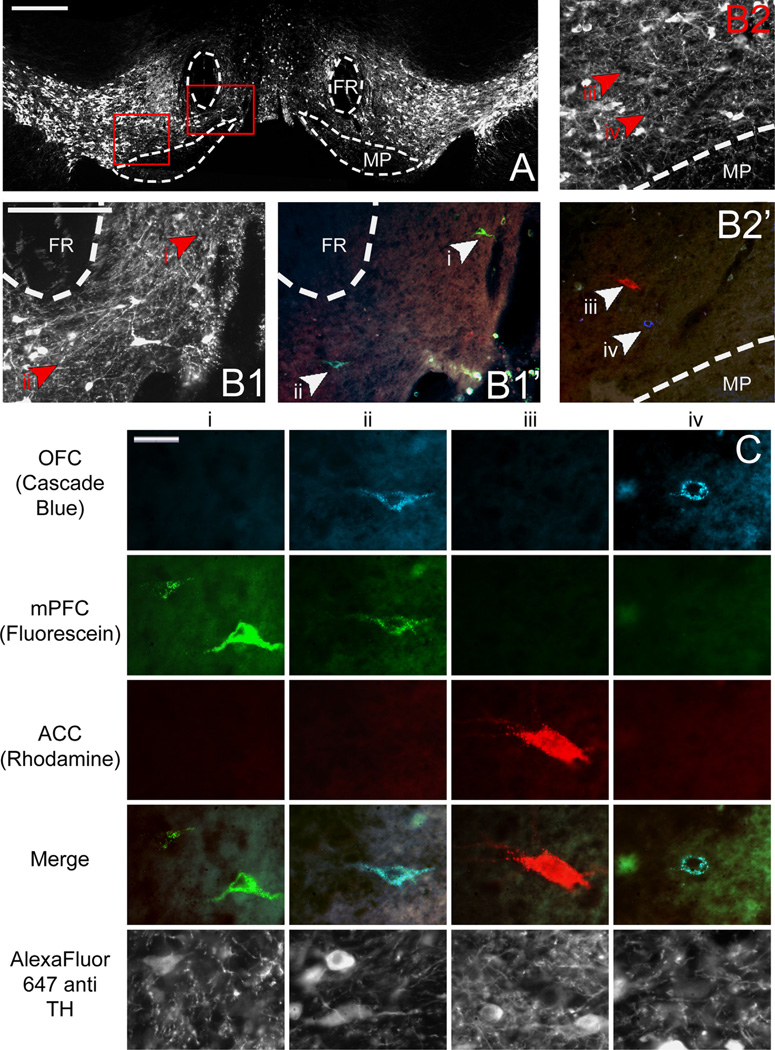
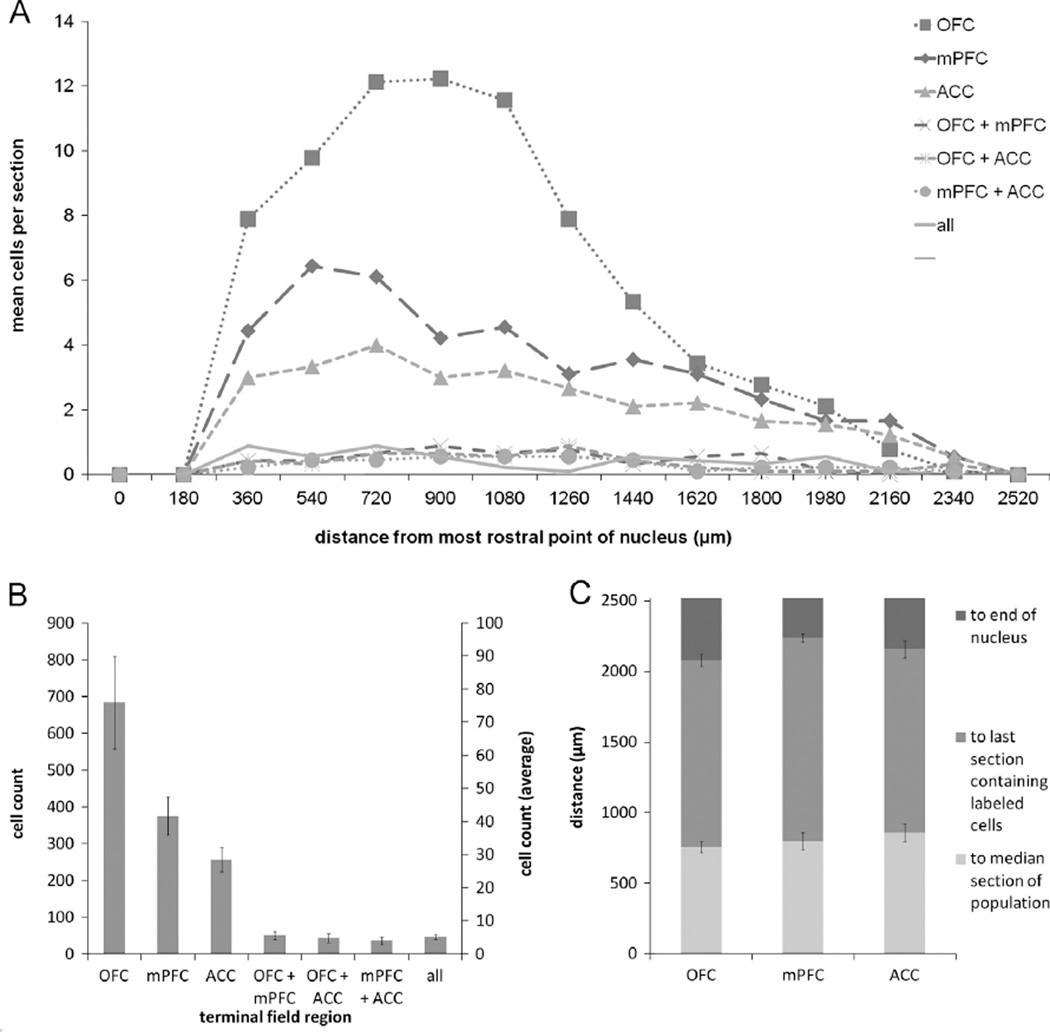
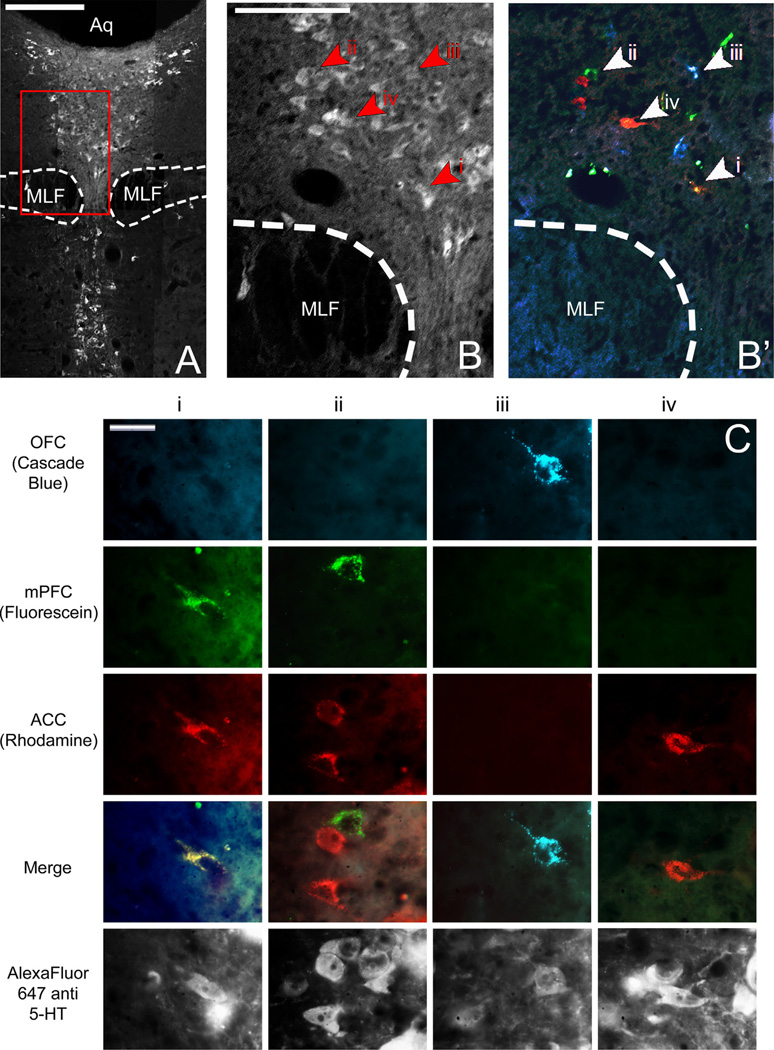
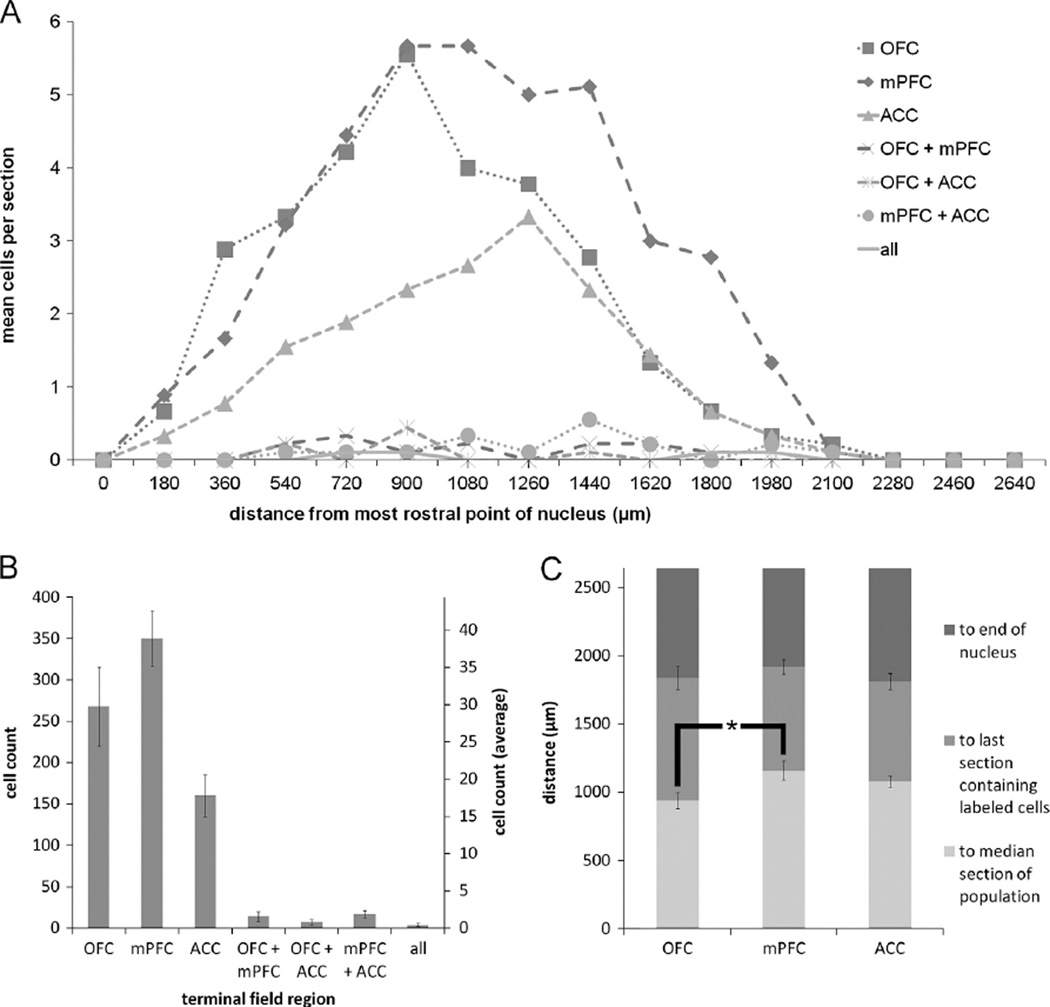
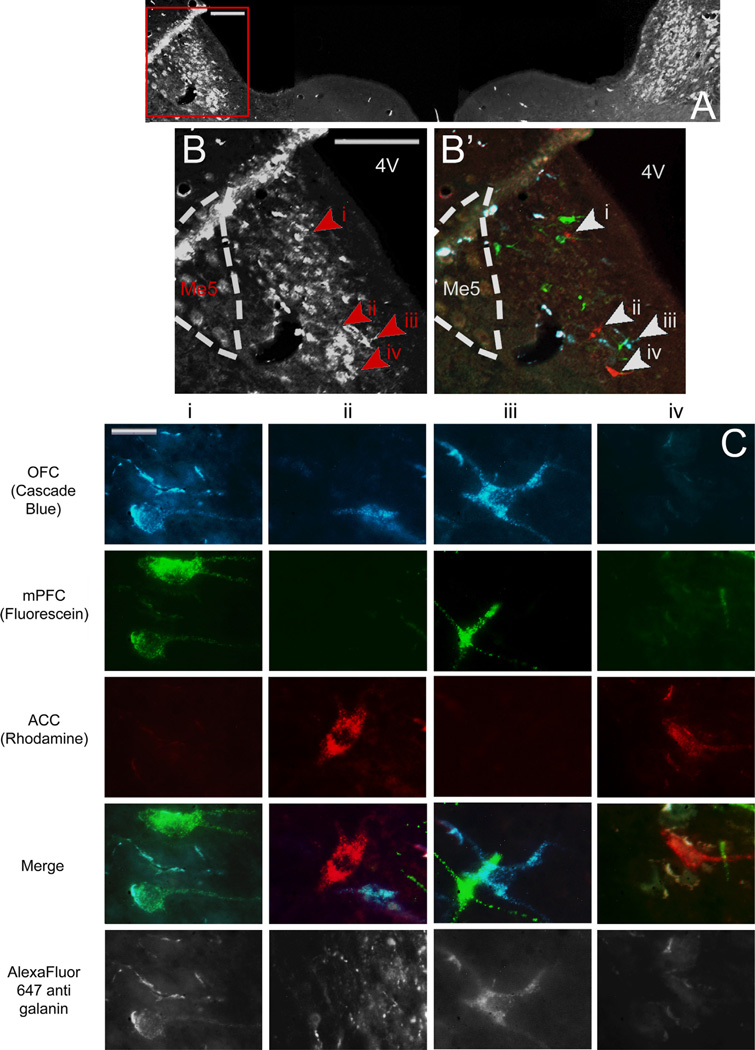
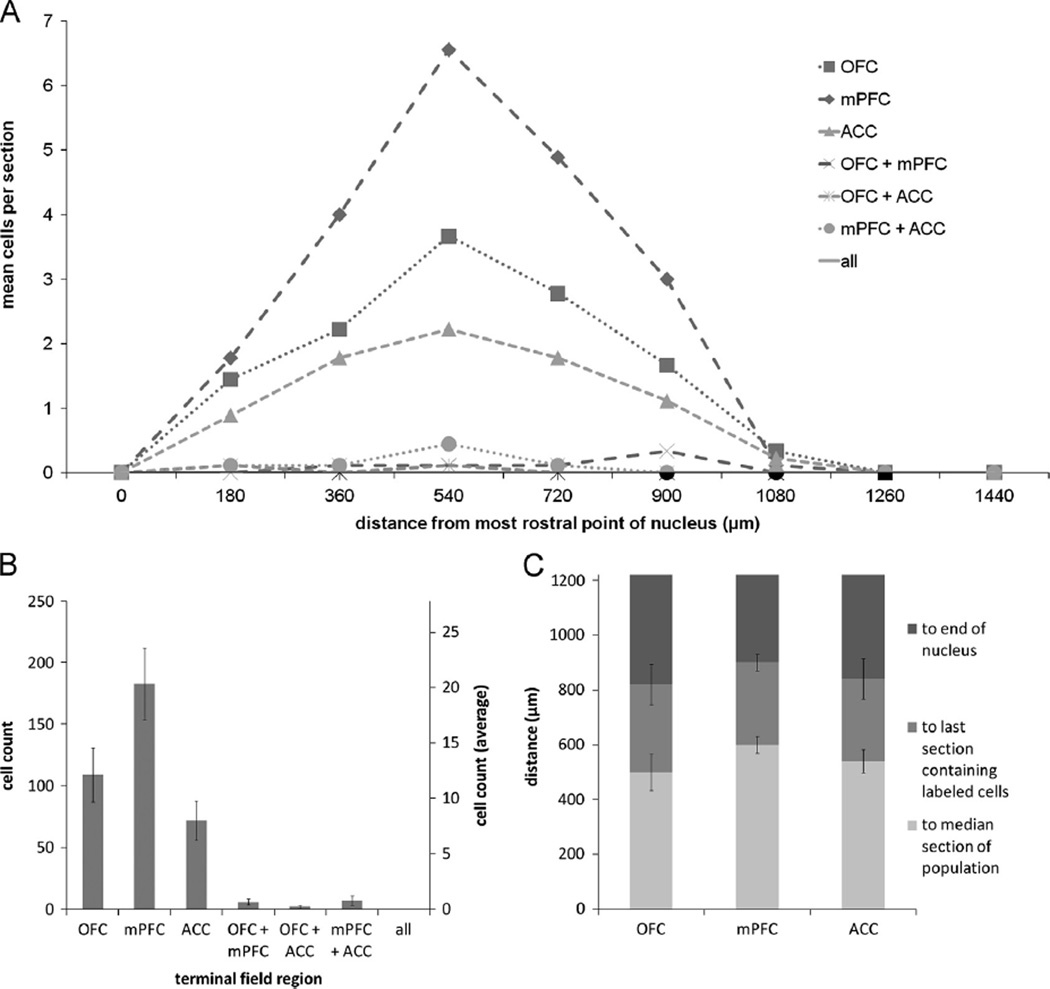
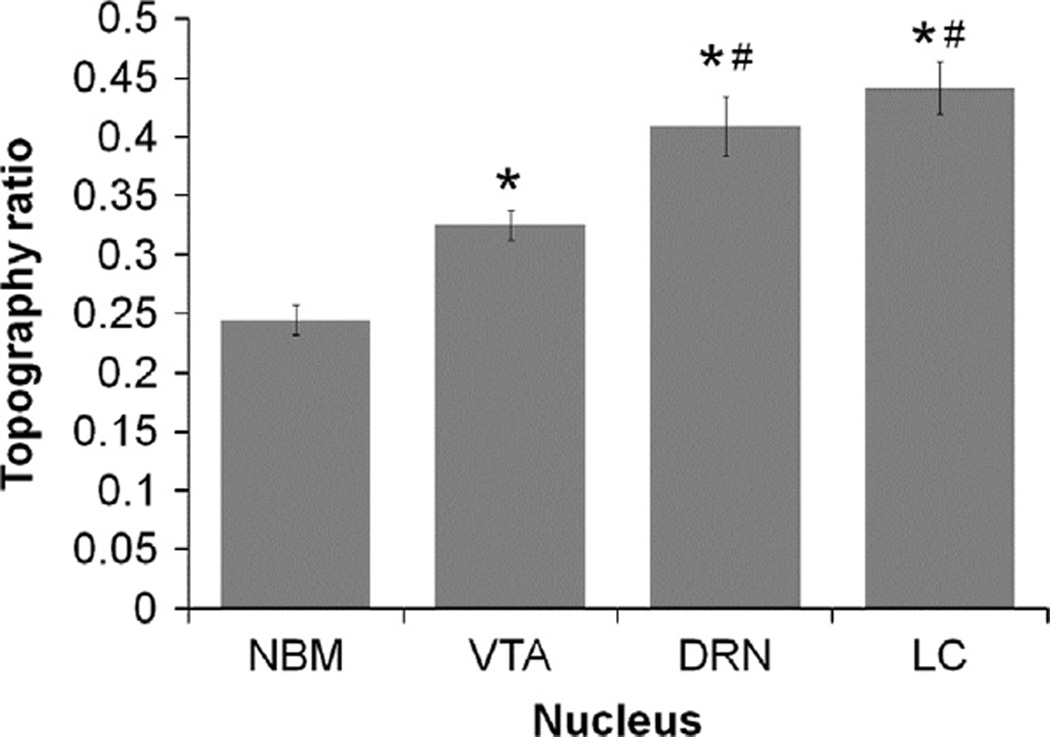
The prefrontal cortex (PFC) is implicated in a variety of cognitive and executive functions and is composed of several distinct networks, including anterior cingulate cortex (ACC), medial prefrontal cortex (mPFC), and orbitofrontal cortex (OFC). These regions serve dissociable cognitive functions, and are heavily innervated by acetylcholine, dopamine, serotonin and norepinephrine systems. In this study, fluorescently labeled retrograde tracers were injected into the ACC, mPFC, and OFC, and labeled cells were identified in the nucleus basalis (NB), ventral tegmental area (VTA), dorsal raphe nucleus (DRN) and locus coeruleus (LC). DRN and LC showed similar distributions of retrogradely labeled neurons such that most were single labeled and the largest population projected to mPFC. VTA showed a slightly greater proportion of double and triple labeled neurons, with the largest population projecting to OFC. NB, on the other hand, showed mostly double and triple labeled neurons projecting to multiple subregions. Therefore, subsets of VTA, DRN and LC neurons may be capable of modulating individual prefrontal subregions independently, whereas NB cells may exert a more unified influence on the three areas simultaneously. These findings emphasize the unique aspects of the cholinergic and monoaminergic projections to functionally and anatomically distinct subregions of PFC.


Figures

Fig. 1
Fig. 1
(A) Representative photomicrographs of injection sites in OFC (blue fluorescence), mPFC (green fluorescence) and ACC (red fluorescence) from a single animal. A schematic representation of the rostrocaudal extent of injection sites was created using data pooled from all subjects (n = 9), i.e. the largest and smallest injections at each level are illustrated. The area of the tissue in each section that contained residual fluorescence was calculated with ImageJ software. The boundaries of the largest (lighter color) and smallest (darker color) areas containing fluorescence in each section are shown in B. The mean area filled with residual fluorescence for each PFC subregion was calculated across all 9 animals and was plotted as a function of each section's distance from bregma, and is shown in C. Individual photomicrographs of sections in A and schematics in B align with the values along the X axis of C. The area under each curve in C was calculated to obtain an estimate of the volume of tissue in each PFC subregion that was filled with tracer; these values are shown in D. A significantly greater volume of OFC was filled than mPFC (p<0.05).
Fig. 2
Fig. 2
(A) Low power image of NB through fluorescent filter to show VAChT immunoreactivity. Scale bar=400 µm. (B1 and B2) Higher power images of areas represented in left and right red boxes in (A), respectively. Arrowheads and roman numerals indicate locations of cells represented in C. Scale bar=100 µm. (C) High power images of individual retrogradely labeled putative cholinergic neurons indicated by arrowheads in B through various fluorescence filters to show tracers with which they were labeled and therefore to which subregions of PFC they project. Individual columns show the same cell through various fluorescence filters; individual rows show different cells through the same fluorescence filter. Scale bar=20 µm. NB, Nucleus basalis; RT, reticular nucleus of thalamus; VAChT, vesicular acetylcholine transporter; OFC, orbitofrontal cortex; mPFC, medial prefrontal cortex; ACC, anterior cingulate cortex.
Fig. 3
Fig. 3
(A) Mean number of retrogradely labeled NB cells per section per rat according to rostrocaudal position for the various populations of projection neurons. (B) Cumulative (left axis) and mean ± SEM (right axis) counts of retrogradely labeled neurons projecting to each possible combination of terminal fields from all animals (n = 7). (C) Distance to the median section, last section which contained retrogradely labeled neurons, and the end of the nucleus ± SEM for the various populations of projection neurons. Note that roughly one-half of the nucleus, i.e. the caudal end, is devoid of retrograde labeling. NB, Nucleus basalis; VAChT, vesicular acetylcholine transporter; OFC, orbitofrontal cortex; mPFC, medial prefrontal cortex; ACC, anterior cingulate cortex.
Fig. 4
Fig. 4
(A) Low power image of VTA through fluorescent filter to show TH immunoreactivity. Scale bar=400 µm. (Bl) Higher magnification of areas enclosed by right red box in (A) through fluorescence filter to show TH immunoreactivity (left, B1) and merged fluorescence filters (right, B12) to show retrogradely labeled cells. (B2) Higher magnification of areas enclosed by left red box in (A) through fluorescence filter to show TH immunoreactivity (top, Bl) and merged fluorescence filters (bottom, B12) to show retrogradely labeled cells. Arrowheads and roman numerals indicate locations of cells represented in (C). Scale bars for B = 200 µm. (C) High power images of individual retrogradely labeled VTA neurons indicated by arrowheads in B through various fluorescence filters to show tracers with which they were labeled and therefore to which subregions of PFC they project. Individual columns show the same cell through various fluorescence filters; individual rows show different cells through the same fluorescence filter. Scale bar=20 µm. VTA, ventral tegmental area; FR, fasciculus retroflexus; MP, mammilary peduncle; TH, tyrosine hydroxylase; OFC, orbitofrontal cortex; mPFC, medial prefrontal cortex; ACC, anterior cingulate cortex.
Fig. 5
Fig. 5
(A) Mean number of retrogradely labeled VTA cells per section per rat according to rostrocaudal position for the various populations of projection neurons. (B) Cumulative (left axis) and mean ± SEM (right axis) counts of retrogradely labeled neurons projecting to each possible combination of terminal fields from all animals (n = 9). (C) Distance to the median section, last section which contained retrogradely labeled neurons, and the end of the nucleus ± SEM for the three populations of singly-projecting neurons. VTA, ventral tegmental area; TH, tyrosine hydroxylase; OFC, orbitofrontal cortex; mPFC, medial prefrontal cortex; ACC, anterior cingulate cortex.
Fig. 6
Fig. 6
(A) Low power image of DRN through fluorescent filter to show 5HT immunoreactivity. Scale bar=400µm. (B) Higher magnification of area enclosed by red box in (A) through fluorescence filter to show 5HT immunoreactivity (left, B) and merged fluorescence filters to show retrogradely labeled cells (right, B2). Arrowheads and roman numerals indicate locations of cells represented in (C). Scale bar=200 µm. (C) High power images of individual retrogradely labeled DRN neurons indicated by arrowheads in B through various fluorescence filters to show tracers with which they were labeled and therefore to which subregions of PFC they project. Individual columns show the same cell through various fluorescence filters; individual rows show different cells through the same fluorescence filter. Scale bar=20 µm. DRN, dorsal raphe nucleus; MLF, medial longitudinal fasiculus, Aq, cerebral aqueduct; 5HT, serotonin; OFC, orbitofrontal cortex; mPFC, medial prefrontal cortex; ACC, anterior cingulate cortex.
Fig. 7
Fig. 7
(A) Mean number of retrogradely labeled DRN cells per section per rat according to rostrocaudal position for the various populations of projection neurons. (B) Cumulative (left axis) and mean ± SEM (right axis) counts of retrogradely labeled neurons projecting to each possible combination of terminal fields from all animals (n = 9). (C) Distance to the median section, last section which contained retrogradely labeled neurons, and the end of the nucleus ± SEM for the three populations of singly-projecting neurons. Note that roughly one-third to one-quarter of the nucleus, i.e. the caudal tail, is devoid of retrograde labeling. OFC projection cells in DRN cluster significantly more rostrally than do mPFC projection cells (p<0.05). DRN, dorsal raphe nucleus; 5HT, serotonin; OFC, orbitofrontal cortex; mPFC, medial prefrontal cortex; ACC, anterior cingulate cortex.
Fig. 8
Fig. 8
(A) Low power image of LC through fluorescent filter to show galanin immunoreactivity. The area enclosed by the red box is shown at higher magnification in B, and through merged fluorescence channels in B2 to show locations of retrogradely labeled cells shown in C. Scale bar in A and B=200 µm. (C) High power images of individual retrogradely labeled LC neurons indicated by arrowheads in B through various fluorescence filters to show tracers with which they were labeled and therefore to which subregions of PFC they project Individual columns show the same cell through various fluorescence filters; individual rows show different cells through the same fluorescence filter. Scale bar=20 µm. LC, locus coeruleus; Me5, mesencephalic trigeminal nucleus; 4V, fourth ventricle; OFC, orbitofrontal cortex; mPFC, medial prefrontal cortex; ACC, anterior cingulate cortex.
Fig. 9
Fig. 9
(A) Mean number of retrogradely labeled LC cells per section per rat according to rostrocaudal position for the various populations of projection neurons. (B) Cumulative (left axis) and mean ± SEM (right axis) counts of retrogradely labeled neurons projecting to each possible combination of terminal fields from all animals (n = 9). (C) Distance to the median section, last section which contained retrogradely labeled neurons, and the end of the nucleus ± SEM for the three populations of singly-projecting neurons. Note that the caudal one-quarter of the nucleus is devoid of retrograde labeling. LC, locus coeruleus; OFC, orbitofrontal cortex; mPFC, medial prefrontal cortex; ACC, anterior cingulate cortex.
Fig. 10
Fig. 10
Distance to the median section for all populations of cells relative to the absolute length of each nucleus. Values closer to zero indicate that cells were clustered more rostrally, while values closer to one indicate that cells clustered more caudally. *: significantly different from NB; #: significantly different than VTA. NB: Nucleus basalis; VTA: ventral tegmental area; DRN: dorsal raphe nucleus; LC: locus coeruleus.

References

    1. Abrams JK, Johnson PL, Hollis JH, Lowry CA. Anatomic and functional topography of the dorsal raphe nucleus. Ann. N. Y. Acad. Sci. 2004;1018:46–57. - PubMed
    1. Alvarez-Maubecin V, Garcia-Hernandez F, Williams JT, Van Bockstaele EJ. Functional coupling between neurons and glia. J. Neurosci. 2000;20(11):4091–4098. - PMC - PubMed
    1. Arvidsson U, Riedl M, Elde R, Meister B. Vesicular acetylcholine transporter (VAChT) protein: a novel and unique marker for cholinergic neurons in the central and peripheral nervous systems. J. Comp. Neurol. 1997;378(4):454–167. - PubMed
    1. Aston-Jones G, Cohen JD. Adaptive gain and the role of the locus coeruleus-norepinephrine system in optimal performance. J. Comp. Neurol. 2005a;493(1):99–110. - PubMed
    1. Aston-Jones G, Cohen JD. An integrative theory of locus coeruleus-norepinephrine function: adaptive gain and optimal performance. Annu. Rev. Neurosci. 2005b;28:403–450. - PubMed

Publication types