. 2013 Jun 6;12(6):699-712.
doi: 10.1016/j.stem.2013.04.013. Epub 2013 May 9.

Genome-wide chromatin interactions of the Nanog locus in pluripotency, differentiation, and reprogramming

Affiliations

Genome-wide chromatin interactions of the Nanog locus in pluripotency, differentiation, and reprogramming

Effie Apostolou et al. Cell Stem Cell. .

Abstract

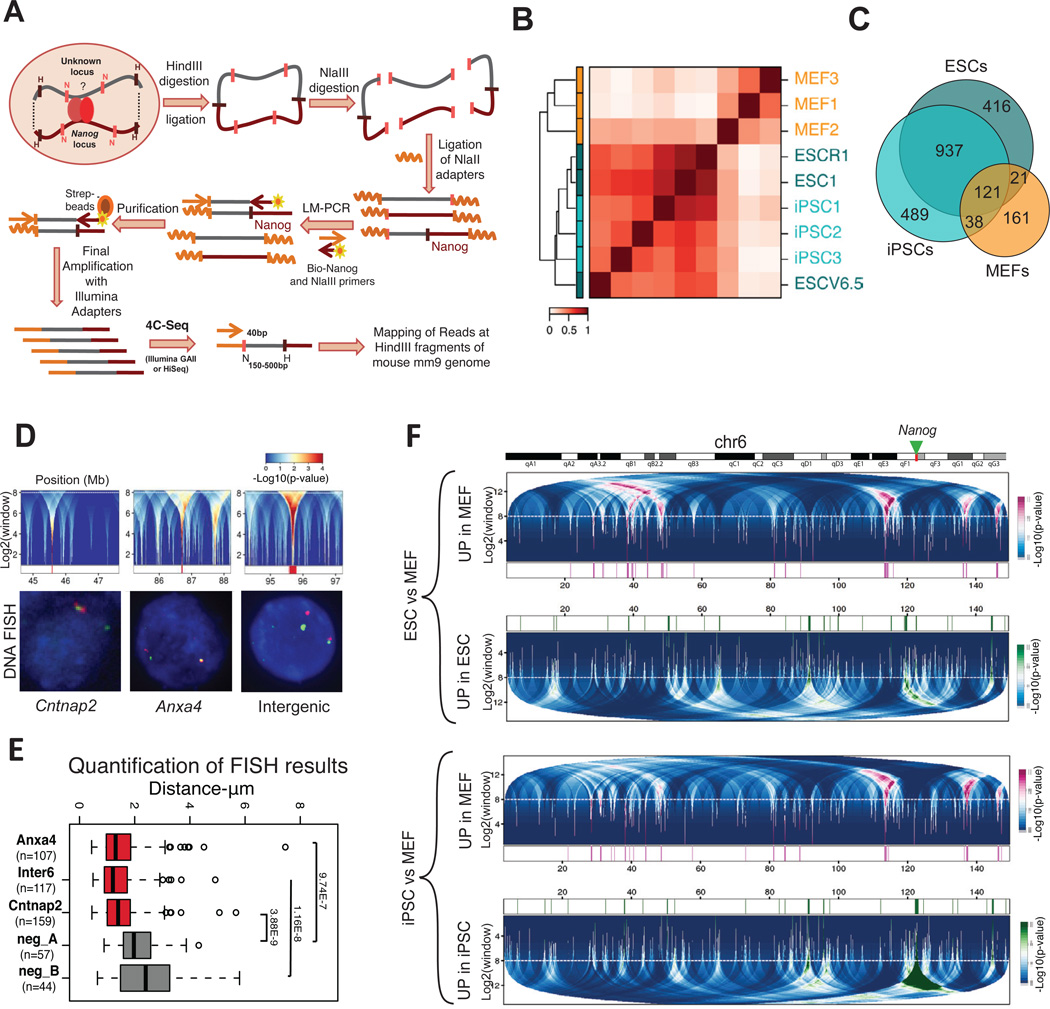
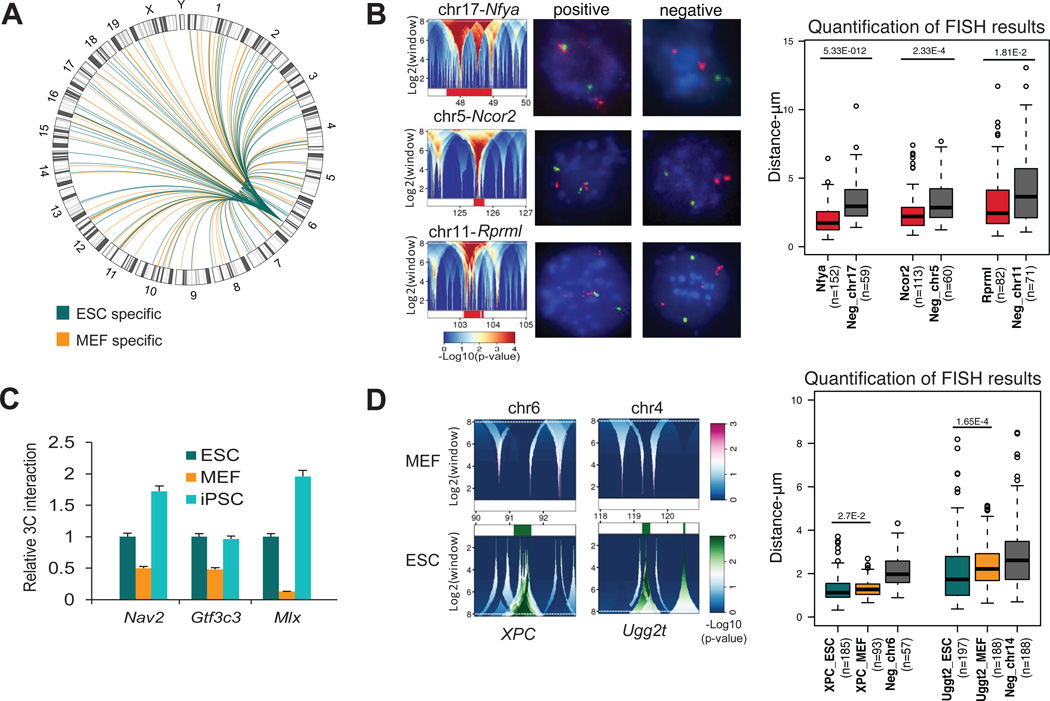
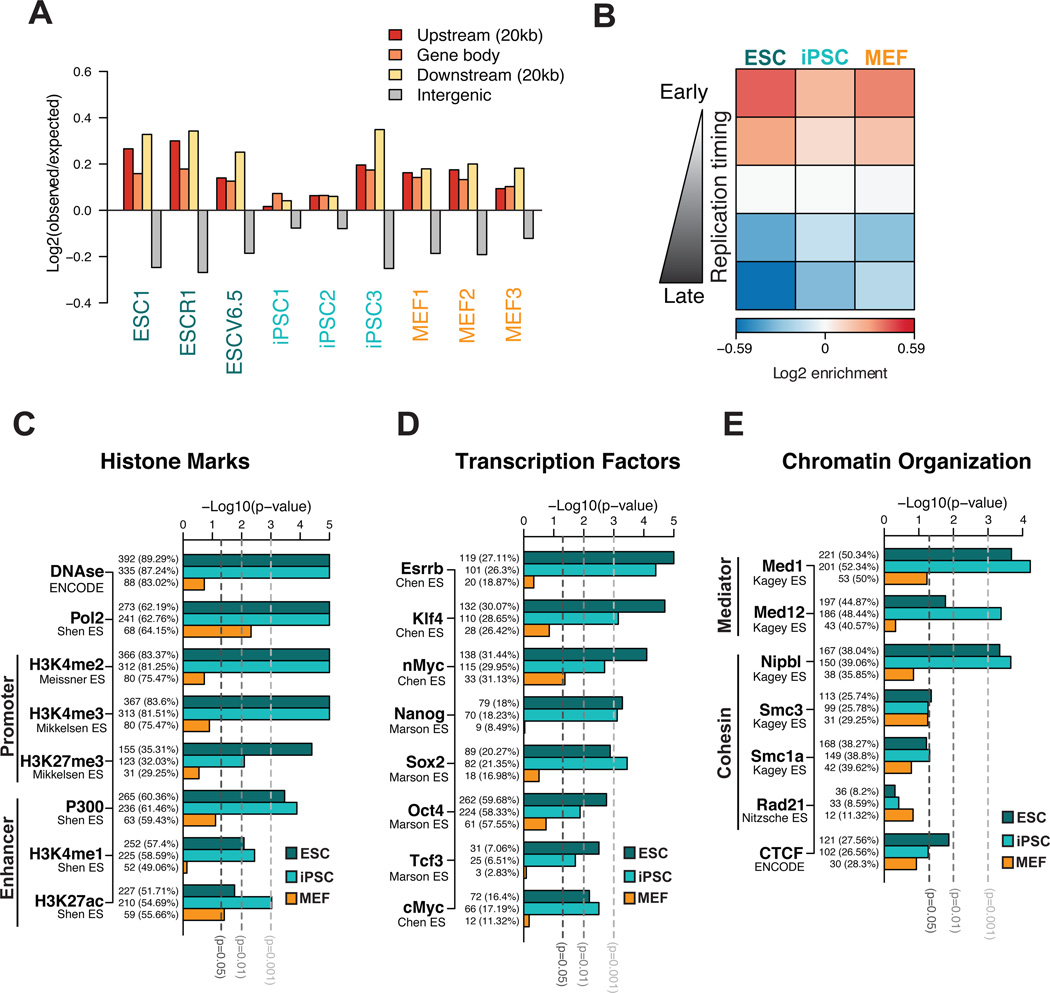
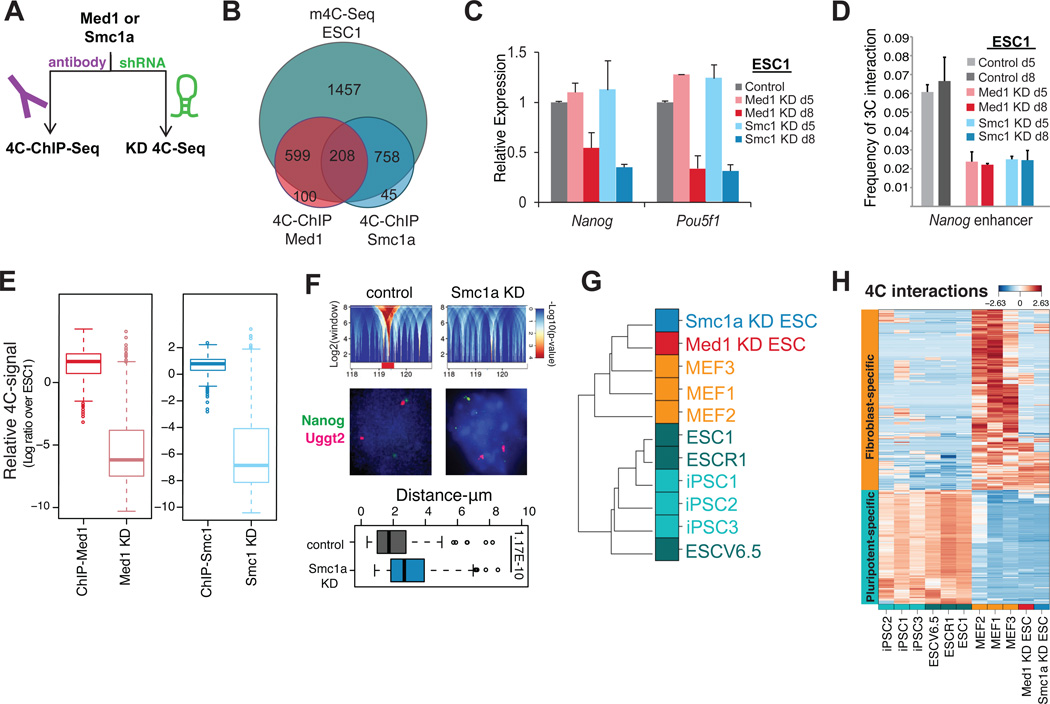
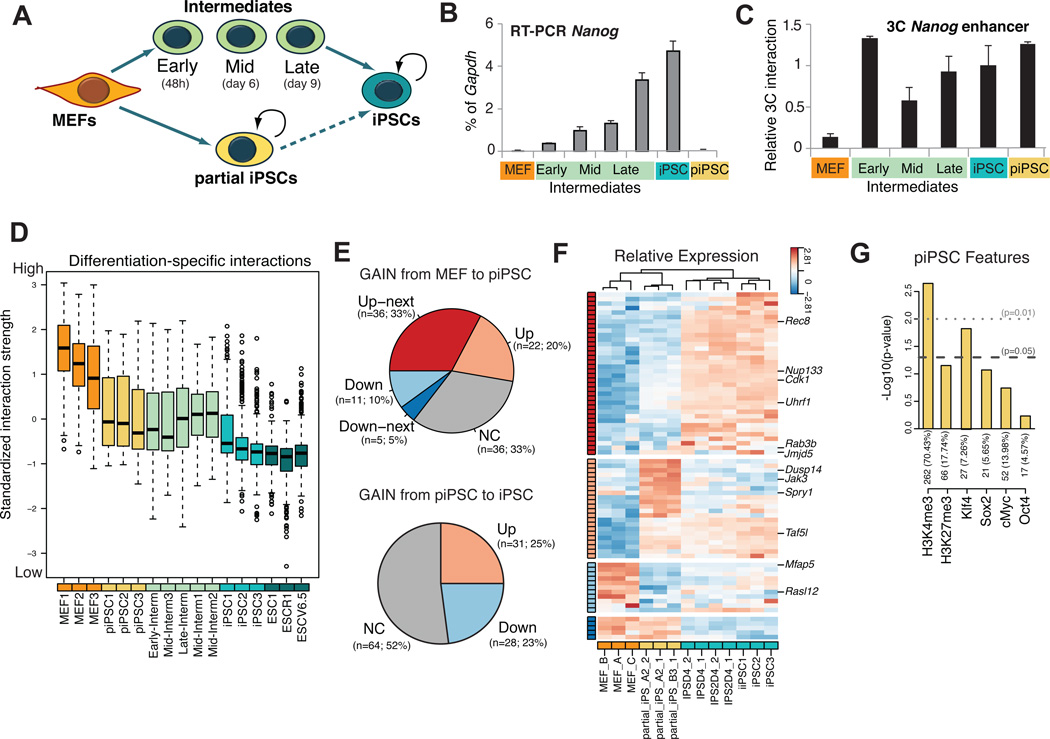
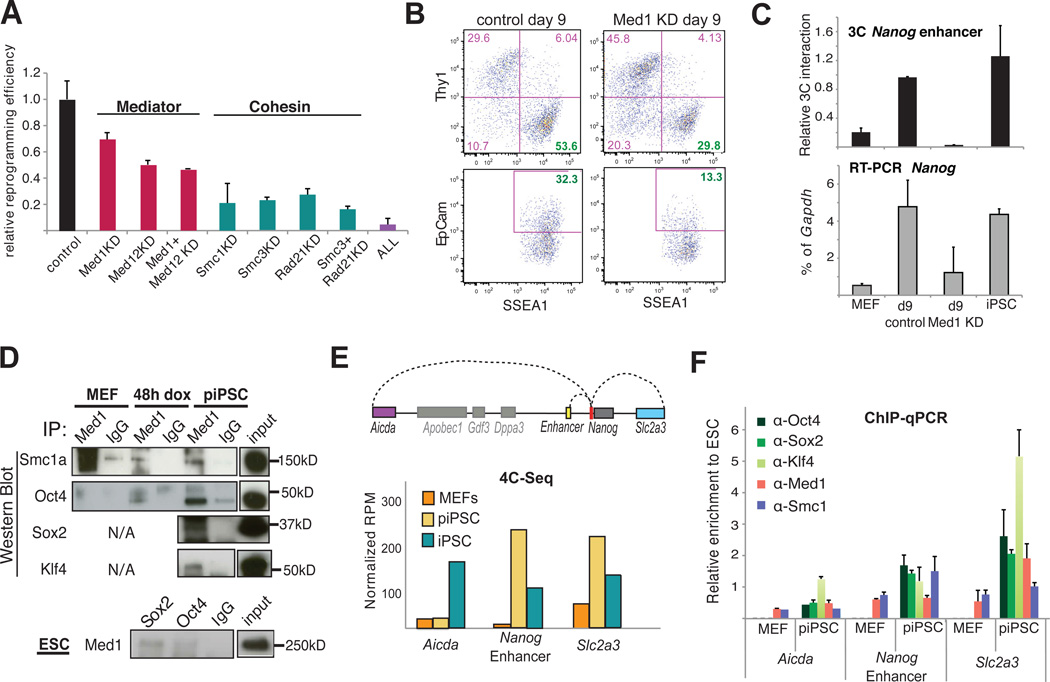
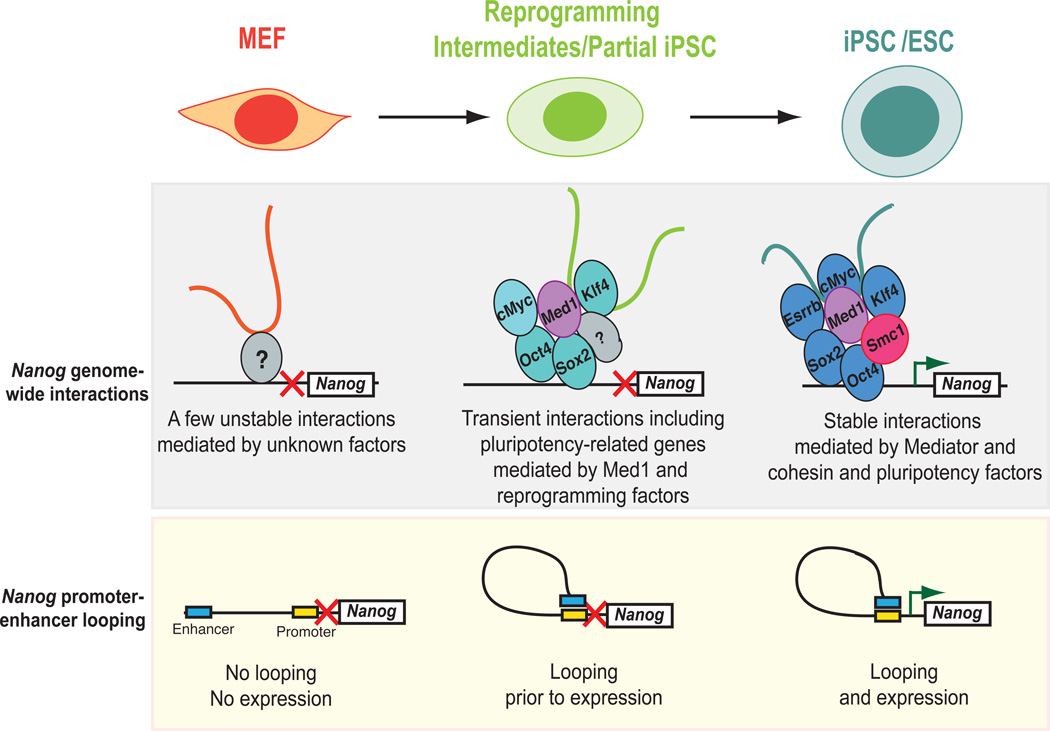
The chromatin state of pluripotency genes has been studied extensively in embryonic stem cells (ESCs) and differentiated cells, but their potential interactions with other parts of the genome remain largely unexplored. Here, we identified a genome-wide, pluripotency-specific interaction network around the Nanog promoter by adapting circular chromosome conformation capture sequencing. This network was rearranged during differentiation and restored in induced pluripotent stem cells. A large fraction of Nanog-interacting loci were bound by Mediator or cohesin in pluripotent cells. Depletion of these proteins from ESCs resulted in a disruption of contacts and the acquisition of a differentiation-specific interaction pattern prior to obvious transcriptional and phenotypic changes. Similarly, the establishment of Nanog interactions during reprogramming often preceded transcriptional upregulation of associated genes, suggesting a causative link. Our results document a complex, pluripotency-specific chromatin "interactome" for Nanog and suggest a functional role for long-range genomic interactions in the maintenance and induction of pluripotency.


Figures

Figure 1
Figure 1. Genome-wide interactions of the Nanog locus in differentiated and pluripotent cells
(A) Schematic representation of m4C-seq. LM-PCR: Ligation Mediated-PCR, strep-beads: streptavidin-conjugated beads. (B) Unsupervised clustering and correlation matrix of pluripotent and differentiated cells (3 ESCs, 3 iPSCs and 3 MEFs). Normalized (observed over expected) m4C-seq signals at individual HindIII fragments are clustered, with Spearman correlation (color gradient) and average linkage. Fragments detected in at least 3 out of 9 samples are used. (C) Venn diagram showing the degree of overlap among the Nanog-interacting HindIII fragments common within each group: ESCs, iPSCs and MEFs. (D) The upper panels show details of domainogram analysis for broad intra-chromosomal interacting domains in individual samples. Regions around broad interacting domains are shown for a representative ESC sample (ESC1 cell line). The centers of interacting domains are marked in red at the bottom (p-value < 0.0001). The dashed horizontal white line indicates the maximum window size cutoff. The bottom panels show representative 3D DNA FISH in ESCs confirming the interaction of Nanog (green FITC signals) with each of those domains (magenta Alexa 568 signals). (E) Boxplot for distances between the Nanog locus and the tested domains (n= number of measured nuclei). Intra-chromosomal regions between the positive hits and the bait position were used as negative controls. P-values for Wilcoxon test are reported (see also Figure S2C). Whiskers extend to most extreme values within 1.5 times the inter quartile range (IQR) from the upper or lower quartile. (F) Differential interactions over large domains (domainogram) for ESCs vs MEFs (upper panel) and iPSC vs MEFs (bottom panel) comparisons in chromosome 6. The green arrow marks Nanog position. Top: interacting domains upregulated in MEF (magenta), Bottom: interacting domains up-regulated in ESC or iPSCs respectively cells (green). In the central part magenta and green marks indicate the regions significantly up-regulated (p-value < 0.001) in MEF or ESC/iPSC, respectively. The dashed horizontal white line indicates the maximum window size cutoff. All replicates for each cell type are taken into account to compute the score for differential interactions. See also Figure S1, S2, Table S1 and S6
Figure 2
Figure 2. Detection and validation of inter-chromosomal associations of the Nanog locus in pluripotent and differentiated cells
(A) Circos plot for differential inter-chromosomal interactions in ESCs (green) compared to MEFs (orange) as detected from broad domains analysis using domainograms (Figure 1F) in each chromosome. (B) Three inter-chromosomal Nanog-interacting domains confirmed by 3D-DNA FISH in ES cells. The domainograms refer to the ESC1 line and are representative of other ESCs. Representative 3D-DNA FISH photos show the Nanog alleles (Green FITC signals) interacting with each of those domains (left) or their corresponding negative controls (right) (Magenta Alexa 568 signals). Boxplots report for 3D-DNA FISH results (n=number of nuclei; p=Wilcoxon test p-value) (whiskers like Figure 1E). Negative controls were selected in regions within 2Mb of the targets. (C) 3C-PCR confirmation of selected differential inter-chromosomal interactions of the Nanog locus in ESCs and iPSCs vs MEF. For each primer pair the PCR signal was calculated relative to the corresponding signal in ESCs (Relative 3C Interaction) after normalization with the PCR signal of primers designed at the bait locus (see Table S6). Error bars indicate standard deviations (n=3 technical replicates). All 3C-PCR products were isolated and analyzed by Sanger sequencing. (D) Domainograms details for differential interactions around XPC and Ugg2t, which were found to interact with Nanog preferentially in ESCs. Upper (magenta) and bottom panels (green) refer to interaction enrichment in MEFs and pluripotent cells, respectively. 3D-DNA FISH results for the two regions are shown in the boxplot similarly to panel B (whiskers like Figure 1E). See also Figure S2, Table S2 and S6
Figure 3
Figure 3. Nanog- interacting regions are enriched for open chromatin features and pluripotency factor binding in pluripotent cells
(A) Distribution of the Nanog-interacting loci detected at single fragment level in each sample. Log ratios of observed over expected fragments in different genomic regions show a consistent overrepresentation of interactions in genes and surrounding regions (20kb upstream or downstream). (B) Association of the Nanog-interacting regions with replication timing (RT). Genomic segments were divided into 5 groups (from early to late) based on their replication timing data in each cell type (Hiratani et al., 2010). The median association of interacting fragments (observed over expected log ratio) across biological replicates is plotted as a heatmap. (C) Association of conserved Nanog interactions within each cell type (ESCs, iPSCs or MEFs) with active or repressive chromatin features. Conserved Nanog interactions were identified by gene-level analysis; ChIP peaks in ESCs were linked to genes when overlapping with a −5Kb/+1Kb window at transcript start. The barplots show the significance of association between Nanog-interacting genes and genes enriched for a given mark, tested independently for each cell type. The number and the percentage of interacting genes with a given chromatin mark are reported for each bar. (D) and (E) show similar analyses of association to genes bound by pluripotency transcription factors in ESCs and genes bound by components of cohesin and Mediator complexes and CTCF in ESCs, respectively. See also Figure S3 and Table S3
Figure 4
Figure 4. Mediator and cohesin coordinate Nanog’s genomic interactions in pluripotent cells
(A) Two-pronged strategy to test the role of candidate proteins in the Nanog interactome in ESCs. (B) Venn diagram depicting the overlap of Nanog-interacting HindIII fragments detected by m4C-ChIP-seq for either Med1 or Smc1a compared to m4C-seq in ESC line ESC1. (C) RT-PCR analysis for pluripotency genes Nanog and Pou5f1 in ESCs treated with shRNAs against Med1 or Smc1 for 5 (d5) or 8 days (d8). Error bars indicate standard deviation (n=3 technical replicates). m4C-seq analysis was performed on day 5, before downregulation of Nanog or Pou5f1 and apparent differentiation of cells. (D) 3C-PCR quantifying the interaction frequency between the Nanog promoter and enhancer in control ESCs and in ESCs harvested 5 (d5) or 8 days (d8) after knocking down Med1 or Smc1a. For each primer pair the PCR signal was normalized to the PCR signal of primers designed at the bait locus (see Table S6). Error bars indicate standard deviations (n=3 technical replicates). (E) Boxplot reporting the relative change in 4C-seq normalized signal of the 4C-ChIP selected fragments compared to ESC1 (log2 ratio) (whiskers like Figure 1E). (F) Top: Domanograms details showing the interaction of Nanog with Uggt2 locus in control ESC1 and its disruption in Smc1a KD ESC1. Middle: Representative DNA FISH photos for Nanog (FITC signal) and Uggt2 (Magenta signal) in control or Smc1a knockdown ESCs. Bottom: Boxplot for distances between the Nanog and Ugg2t as measured by DNA FISH (whiskers like Figure 1E). The difference is significant (Wilcoxon test). (G) Unsupervised clustering of samples is performed as in Figure 1B with the addition of the ESC samples for Med1 or Smc1a knock down (KD). (H) Heatmap showing the relative change in m4C-seq signal for the set of 4C fragments selected as differential interactions between ESCs and MEFs, clearly showing that in Med1 or Smc1a knock down sample the pluripotency specific interactions have been lost. Rows refer to individual HindIII fragments and columns are different 4C-seq samples. Color refers to standardized values across samples (z-score) for log transformed normalized 4C read counts. See also Figure S4, Table S4 and S6
Figure 5
Figure 5. Dynamic change of Nanog interactome during cellular reprogramming into iPSCs
(A) Isolation and study of reprogramming intermediates and partially reprogrammed cells (piPSCs). (B) RT-PCR analysis for Nanog mRNA in each cell type. The Nanog expression is normalized over Gapdh (% of Gapdh). The error bars indicate standard deviation (n=3 technical replicates). (C) 3C analysis of relative interaction frequency between the Nanog promoter and enhancer during reprogramming and in the partial iPSCs. The PCR signal is relative to ESCs (Relative 3C Interaction) after normalization with bait locus primers (see Table S6). Error bars are standard deviation (n=3 technical replicates). (D) Boxplot for standardized interaction strength for differentiation-specific fragments (whiskers like Figure 1E). The fragments were selected as differential fragments up-regulated in MEFs vs. ESCs. Five groups of samples are shown: ESCs, iPSCs, SSEA1+ intermediates, partially reprogrammed iPSCs (piPSC) and MEFs. SSEA1-intermediates and piPSCs show an intermediate interaction strength between stronger MEFs and weaker ESCs/iPSCs. For each fragment, the log transformed normalized 4C read counts are standardized by subtracting the mean value across all of the samples, then dividing over standard deviation (z- score) (see also Figure S5D). (E) Pie charts showing the number of genes, which have established (gain) interactions with Nanog during the transition from MEFs to piPSCs (upper panel) or from piPSC to iPSC (lower panel). Genes are grouped based on the change of expression detected by microarray data (FDR 0.05, fold change 1.3) (Sridharan and Hochedlinger datasets – Table S3 and Figure S5G). Up/Down are up-/down-regulated in the transition from MEFs to piPSCs (upper panel) or from piSPC to iPSC (lower panel); Up-/Down-next (ONLY for the upper panel) are Up-/Down-regulated in the next stage, i.e. the transition from piPSCs to iPSCs (see also panel F); NC is for genes without statistically significant change in expression. The number of genes and percentage over the total are indicated. We found significant enrichment in the “Up-next” group (one tail Fisher test p 0.001). Gene level interactions detected in all piPSC replicates and in none of the MEFs were used. Alternative selection of differentially or piPSC specific (transient) interacting genes supported the same conclusions. (F) Heatmap showing in expression of Nanog-interacting genes gained in the MEF to piPSC transition as in (E). Rows are genes and columns are microarray samples (Table S3). Expression pattern groups were defined as in (E) and marked accordingly with the side color bar. Some genes showed significant up-regulation in both the MEFs to piPSCs and in the piPSCs to iPSCs transitions. In this case they were assigned to the “Up-next” group as well. The statistically significant enrichment in “Up-next” pattern is confirmed even if these genes are assigned to the “Up” group. The heatmap shows standardized gene expression levels across samples (z-score). (G) Association of conserved Nanog-interacting genes in piPSCs with H3K4me3, H3K27me3 and pluripotency TFs binding in the same cell type. Number and percentage of interacting genes with ChIP enrichment is reported for each bar. Similar analysis criteria as in Figure 3. See also Figure S5 and Table S5.
Figure 6
Figure 6. Role of Mediator and cohesin on the reprogramming of MEFs to iPSCs
(A) Graph comparing the reprogramming efficiency of tetO-OKSM MEFs after infection with empty vector (control) or or shRNA vectors (KD) against individual subunits of Mediator (Med1, Med12) or cohesin (Smc1a, Smc3, Rad21) complexes or combinations of them. The efficiency was calculated as a ratio of AP-positive colonies to the starting number of cells, expressed as a fraction of the analogous ratio for the control MEFs. Error-bars indicate standard deviation (n=3 biological replicates) (B) FACS plots of SSEA1 positive or EpCam positive cells on day 9 of reprogramming starting with either wild type (left) or Med1-knocked down (KD, right) reprogrammable MEFs. SSEA1 and EpCam are picked as early or late, respectively, surface markers of pluripotency. (C) RT-PCR (bottom) for Nanog expression and 3C assay (top) for Nanog enhancer-promoter interaction in MEFs, iPSCs and reprogramming Intermediates of control or Med1 knockdown MEFs (Med1 KD) on day 9. 3C PCR signal was calculated relative to ESCs (Relative 3C Interaction) after normalization with bait locus primers (Table S6). Error bars are standard deviation (n=2 technical replicates). RT-PCR Nanog signal was normalized to Gapdh levels and the error bars indicate standard deviation (n=4 replicates). (D) Med1 protein immunoprecipitation (upper panels) in reprogrammable MEFs before (MEF) and after doxycyclin induction (MEF 48hr) and in partial iPSC (piPSC). In the bottom panel, the interaction of Med1 with Oct4, Sox2 and Nanog was also confirmed in ESCs, this time using antibodies for the reprogramming factors for the pull down. (E) Schematic representation of the genomic regions found to interact in cis with the Nanog promoter (red) in a pluripotent specific way (top). Barplot of m4C-seq signal for each of the indicated regions in MEFs, partial iPSC (piPSC) and ESCs. The signal is expressed in reads per million (RPM) and represents the average value of 3 biological replicates. (F) Chromatin Immunoprecipitation (ChIP) experiments of the reprogramming factors Oct4, Sox2 and Klf4 as well as Med1 and Smc1a on the indicated genomic regions in MEFs and partial iPSCs (piPSC). All the ChIP-qPCR signals are first normalized to the input and then, expressed relative to the corresponding signal in ESCs (See also Figure S6). Error bars indicate standard deviation. See also Figure S6 and Table S6.
Figure 7
Figure 7. Model depicting dynamics of Nanog interactions during differentiation and cellular reprogramming
The Nanog locus engages in genome-wide chromatin interactions in MEFs (“MEF-specific interactome”) that are highly variable, possibly because the Nanog gene is inactive in differentiated cells. During reprogramming, the complexity of interactions increases, presumably by the cooperative action of the overexpressed reprogramming factors and “bridging” factors, including Mediator components (Med1). The majority of the interactions gained in the partial iPSC lead to upregulation of the involved genes immediately or in iPSCs. Once cells reach the pluripotent state, different and more stable interactions are established. These pluripotency-specific interactions are mainly maintained by cohesin and Mediator complexes as well as the key pluripotency factors. Upon normal differentiation or depletion of either Med1 or Smc1a, the Nanog-interactome is rearranged into the less organized differentiated state.

Comment in

  • The 3D genome shapes up for pluripotency.
    Sexton T, Cavalli G. Sexton T, et al. Cell Stem Cell. 2013 Jul 3;13(1):3-4. doi: 10.1016/j.stem.2013.06.013. Cell Stem Cell. 2013. PMID: 23827701
  • Rearranging the chromatin for pluripotency.
    Ferrari F, Apostolou E, Park PJ, Hochedlinger K. Ferrari F, et al. Cell Cycle. 2014;13(2):167-8. doi: 10.4161/cc.27028. Epub 2013 Nov 15. Cell Cycle. 2014. PMID: 24241209 Free PMC article. No abstract available.

References

    1. A user's guide to the encyclopedia of DNA elements (ENCODE) PLoS Biol. 2011;9:e1001046. - PMC - PubMed
    1. Apostolou E, Thanos D. Virus Infection Induces NF-kappaB-dependent interchromosomal associations mediating monoallelic IFN-beta gene expression. Cell. 2008;134:85–96. - PubMed
    1. Bantignies F, Roure V, Comet I, Leblanc B, Schuettengruber B, Bonnet J, Tixier V, Mas A, Cavalli G. Polycomb-dependent regulatory contacts between distant Hox loci in Drosophila. Cell. 2011;144:214–226. - PubMed
    1. Borggrefe T, Yue X. Interactions between subunits of the Mediator complex with gene-specific transcription factors. Semin Cell Dev Biol. 2011;22:759–768. - PubMed
    1. Buganim Y, Faddah DA, Cheng AW, Itskovich E, Markoulaki S, Ganz K, Klemm SL, van Oudenaarden A, Jaenisch R. Single-cell expression analyses during cellular reprogramming reveal an early stochastic and a late hierarchic phase. Cell. 2012;150:1209–1222. - PMC - PubMed

Publication types

LinkOut - more resources