

Identifying network motifs that buffer front-to-back signaling in polarized neutrophils
- PMID: 23665220
- PMCID: PMC3674638
- DOI: 10.1016/j.celrep.2013.04.009
Identifying network motifs that buffer front-to-back signaling in polarized neutrophils
Abstract
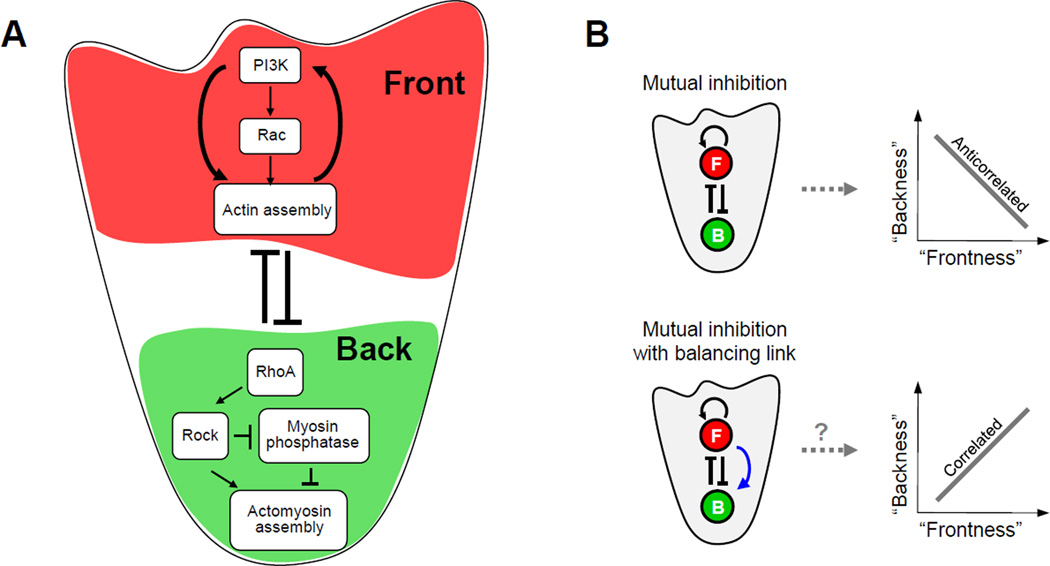
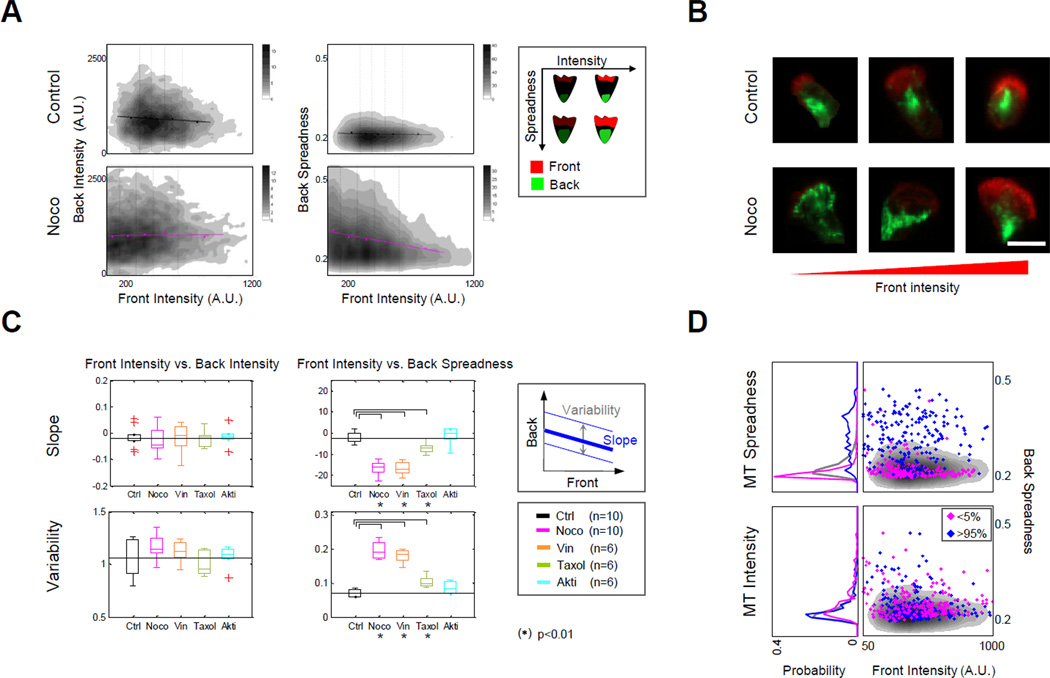
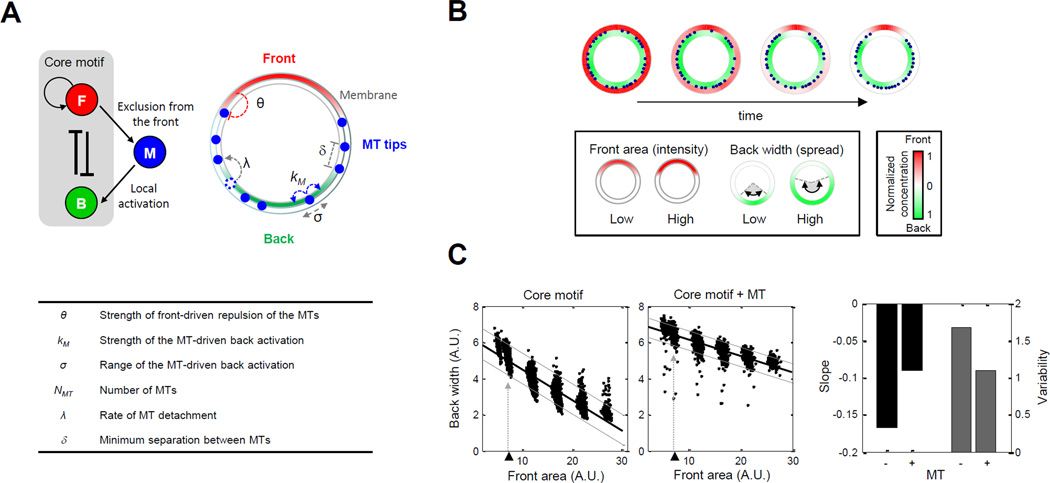
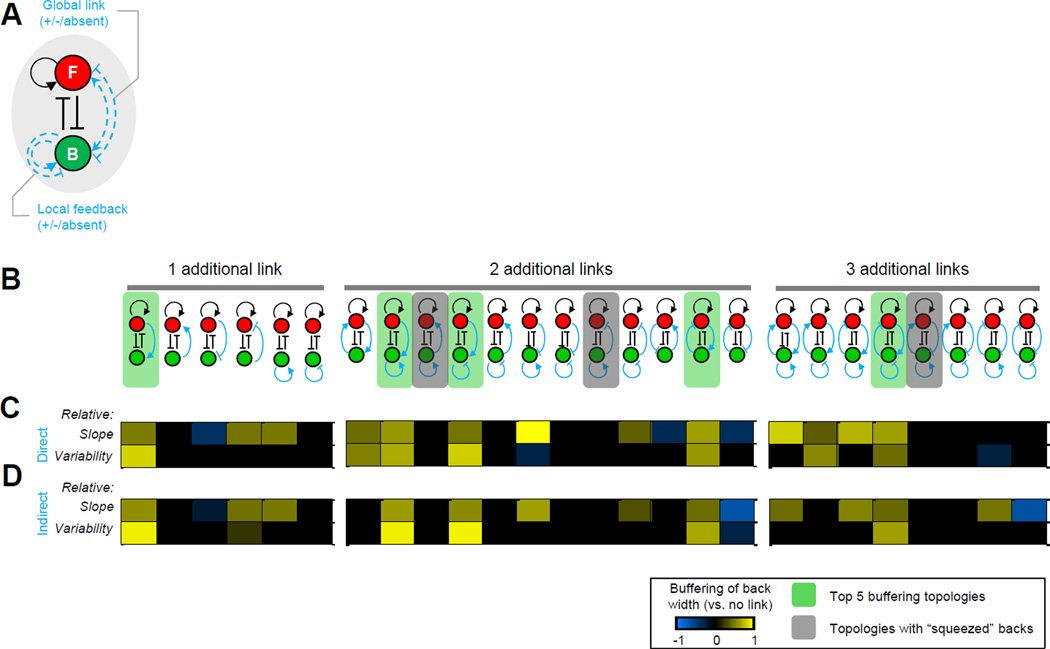
Neutrophil polarity relies on local, mutual inhibition to segregate incompatible signaling circuits to the leading and trailing edges. Mutual inhibition alone should lead to cells having strong fronts and weak backs or vice versa. However, analysis of cell-to-cell variation in human neutrophils revealed that back polarity remains consistent despite changes in front strength. How is this buffering achieved? Pharmacological perturbations and mathematical modeling revealed a functional role for microtubules in buffering back polarity by mediating positive, long-range crosstalk from front to back; loss of microtubules inhibits buffering and results in anticorrelation between front and back signaling. Furthermore, a systematic, computational search of network topologies found that a long-range, positive front-to-back link is necessary for back buffering. Our studies suggest a design principle that can be employed by polarity networks: short-range mutual inhibition establishes distinct signaling regions, after which directed long-range activation insulates one region from variations in the other.
Copyright © 2013 The Authors. Published by Elsevier Inc. All rights reserved.
Figures
Similar articles
-
Network crosstalk dynamically changes during neutrophil polarization.Cell. 2012 May 25;149(5):1073-83. doi: 10.1016/j.cell.2012.03.044. Cell. 2012. PMID: 22632971 Free PMC article.
-
The role of microtubules in neutrophil polarity and migration in live zebrafish.J Cell Sci. 2012 Dec 1;125(Pt 23):5702-10. doi: 10.1242/jcs.108324. Epub 2012 Sep 19. J Cell Sci. 2012. PMID: 22992461 Free PMC article.
-
EB1 contributes to proper front-to-back polarity in neutrophil-like HL-60 cells.Eur J Cell Biol. 2017 Mar;96(2):143-153. doi: 10.1016/j.ejcb.2017.01.006. Epub 2017 Jan 19. Eur J Cell Biol. 2017. PMID: 28132723
-
Microtubules in cell migration.Annu Rev Cell Dev Biol. 2013;29:471-99. doi: 10.1146/annurev-cellbio-101011-155711. Epub 2013 Jul 12. Annu Rev Cell Dev Biol. 2013. PMID: 23875648 Review.
-
Crosstalk of cell polarity signaling pathways.Protoplasma. 2017 May;254(3):1241-1258. doi: 10.1007/s00709-017-1075-2. Epub 2017 Mar 14. Protoplasma. 2017. PMID: 28293820 Review.
Cited by
-
PHOCOS: inferring multi-feature phenotypic crosstalk networks.Bioinformatics. 2016 Jun 15;32(12):i44-i51. doi: 10.1093/bioinformatics/btw251. Bioinformatics. 2016. PMID: 27307643 Free PMC article.
-
On comparing heterogeneity across biomarkers.Cytometry A. 2015 Jun;87(6):558-67. doi: 10.1002/cyto.a.22599. Epub 2014 Nov 25. Cytometry A. 2015. PMID: 25425168 Free PMC article.
-
Mutually inhibitory Ras-PI(3,4)P2 feedback loops mediate cell migration.Proc Natl Acad Sci U S A. 2018 Sep 25;115(39):E9125-E9134. doi: 10.1073/pnas.1809039115. Epub 2018 Sep 7. Proc Natl Acad Sci U S A. 2018. PMID: 30194235 Free PMC article.
-
Locally excitable Cdc42 signals steer cells during chemotaxis.Nat Cell Biol. 2016 Feb;18(2):191-201. doi: 10.1038/ncb3292. Epub 2015 Dec 21. Nat Cell Biol. 2016. PMID: 26689677 Free PMC article.
-
Actuation of single downstream nodes in growth factor network steers immune cell migration.Dev Cell. 2023 Jul 10;58(13):1170-1188.e7. doi: 10.1016/j.devcel.2023.04.019. Epub 2023 May 22. Dev Cell. 2023. PMID: 37220748 Free PMC article.
References
-
- Boyum Isolation of mononuclear cells and granulocytes from human blood. Isolation of monuclear cells by one centrifugation, and of granulocytes by combining centrifugation and sedimentation at 1 g. Scand J Clin Lab Invest Suppl. 1968;97:77–89. - PubMed
-
- Cagatay Turcotte, et al. Architecture-dependent noise discriminates functionally analogous differentiation circuits. Cell. 2009;139:512–522. - PubMed
Publication types
MeSH terms
Grants and funding
LinkOut - more resources
Full Text Sources
Other Literature Sources
