. 2013 Jul;183(1):131-43.
doi: 10.1016/j.ajpath.2013.03.022. Epub 2013 May 8.

Regulation of lung injury and fibrosis by p53-mediated changes in urokinase and plasminogen activator inhibitor-1

Affiliations

Regulation of lung injury and fibrosis by p53-mediated changes in urokinase and plasminogen activator inhibitor-1

Yashodhar P Bhandary et al. Am J Pathol. 2013 Jul.

Abstract

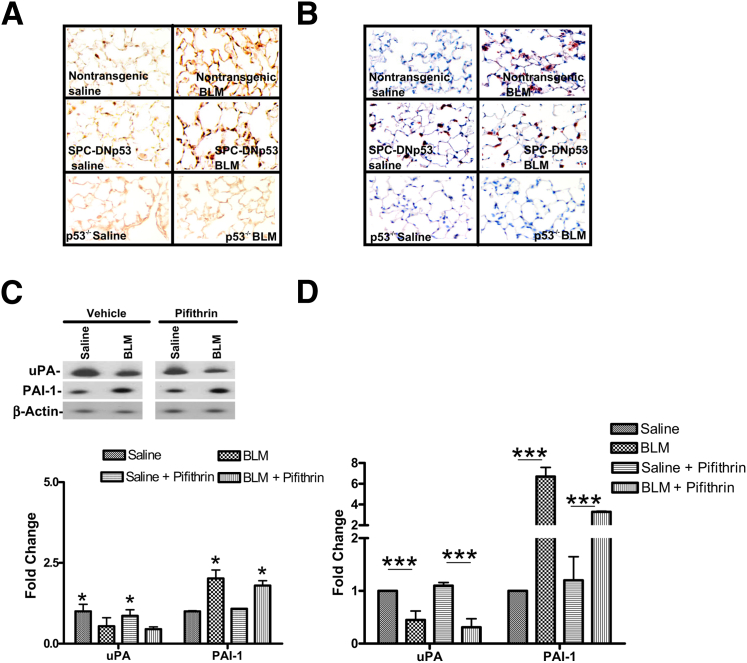
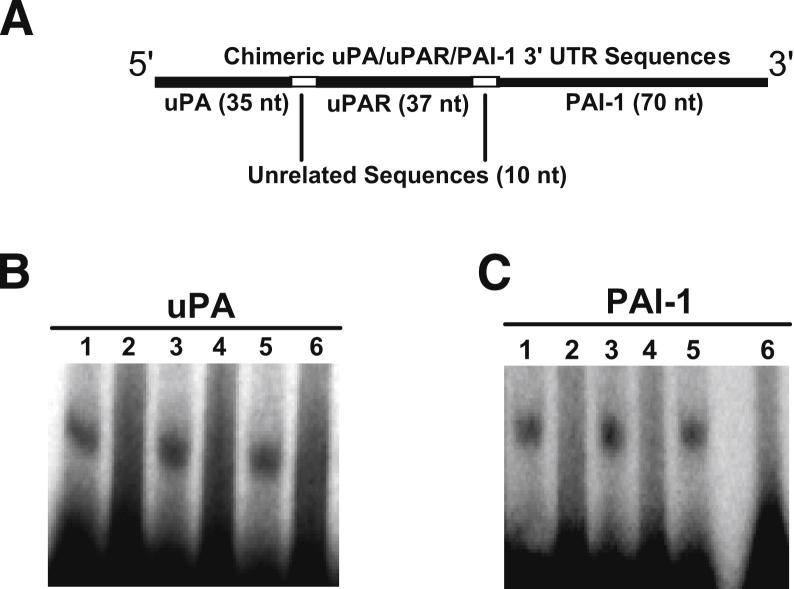
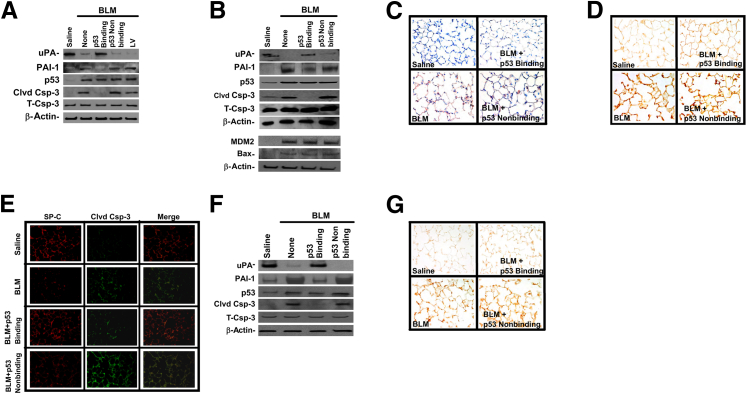
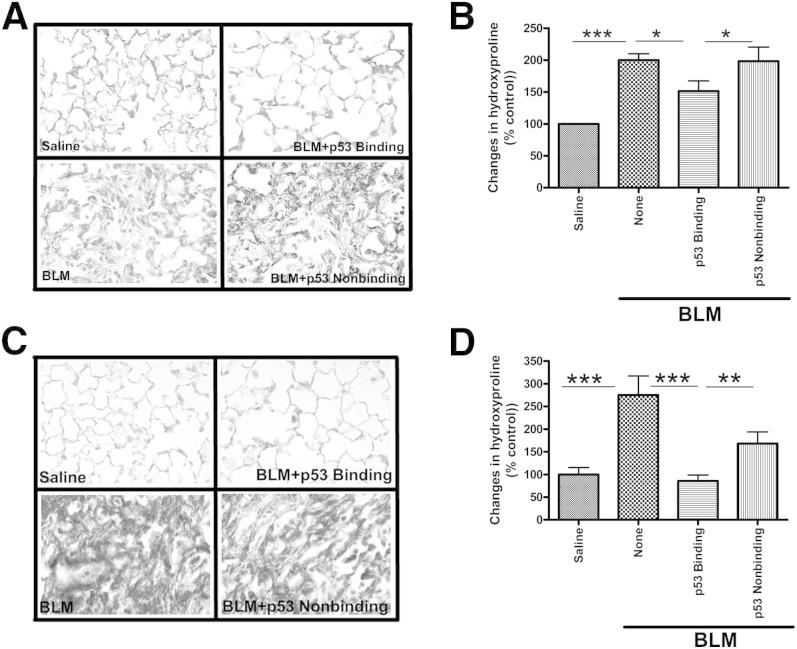
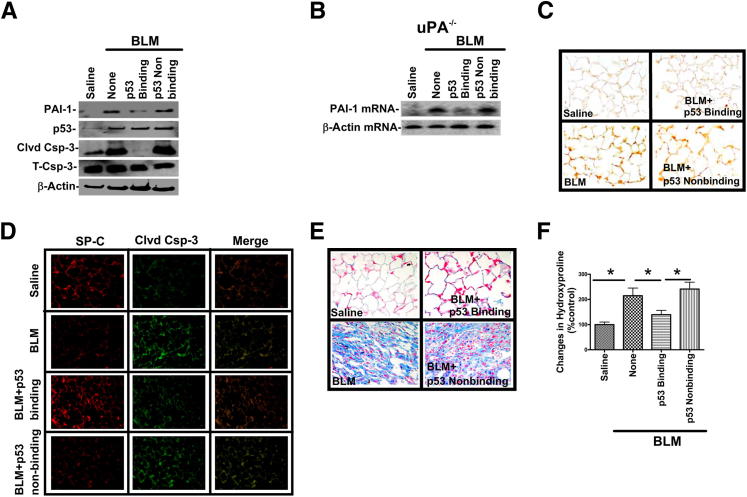
Alveolar type II epithelial cell (ATII) apoptosis and proliferation of mesenchymal cells are the hallmarks of idiopathic pulmonary fibrosis, a devastating disease of unknown cause characterized by alveolar epithelial injury and progressive fibrosis. We used a mouse model of bleomycin (BLM)-induced lung injury to understand the involvement of p53-mediated changes in urokinase-type plasminogen activator (uPA) and plasminogen activator inhibitor-1 (PAI-1) levels in the regulation of alveolar epithelial injury. We found marked induction of p53 in ATII cells from mice exposed to BLM. Transgenic mice expressing transcriptionally inactive dominant negative p53 in ATII cells showed augmented apoptosis, whereas those deficient in p53 resisted BLM-induced ATII cell apoptosis. Inhibition of p53 transcription failed to suppress PAI-1 or induce uPA mRNA in BLM-treated ATII cells. ATII cells from mice with BLM injury showed augmented binding of p53 to uPA, uPA receptor (uPAR), and PAI-1 mRNA. p53-binding sequences from uPA, uPAR, and PAI-1 mRNA 3' untranslated regions neither interfered with p53 DNA binding activity nor p53-mediated promoter transactivation. However, increased expression of p53-binding sequences from uPA, uPAR, and PAI-1 mRNA 3' untranslated regions in ATII cells suppressed PAI-1 and induced uPA after BLM treatment, leading to inhibition of ATII cell apoptosis and pulmonary fibrosis. Our findings indicate that disruption of p53-fibrinolytic system cross talk may serve as a novel intervention strategy to prevent lung injury and pulmonary fibrosis.


Figures

Figure 1
Figure 1
Effects of BLM treatment on temporal changes in the levels of PAI-1, p53, and apoptosis in ATII cells. Levels of PAI-1, p53, active caspase-3 (Clvd Csp-3), and total caspase-3 (T-Csp-3) to assess apoptosis in ATII cells treated in vitro with BLM for up to 28 hours (A) or in ATII cells isolated from mice that received BLM via intranasal instillation for up to 7 days (B) were analyzed via Western blotting. β-Actin levels were determined to correct for loading differences. Data shown in line graphs are means ± SD of three independent experiments. Differences between treatments are statistically significant (*P < 0.05).
Figure 2
Figure 2
Role of p53 in ATII cell apoptosis in mice with BLM-induced injury. Lung sections from WT transgenic mice expressing DNp53 in ATII cells and p53-deficient mice treated with or without BLM were subjected to TUNEL staining to assess apoptosis (A) or to immunohistochemical staining for p53 (B). C: ATII cells isolated from WT mice were exposed to saline solution or BLM with or without pifithrin-α for 24 hours in vitro. Total RNA isolated from these cells was analyzed for uPA and PAI-1 mRNA via reverse transcription-PCR in the presence of P-labeled deoxycytidine triphosphate. P-labeled PCR amplicons were separated on urea or polyacrylamide gel and exposed to X-ray film. D: Total RNA was subjected to quantitative real-time PCR for uPA and PAI-1 mRNA after normalization with β-actin mRNA from the same sample. C and D: Shaded columns represent mean densities after normalization with corresponding densities of β-actin mRNA. Experiments were repeated at least three times. Differences between treatments are statistically significant (*P < 0.05, ***P < 0.005).
Figure 3
Figure 3
Inhibition of p53 binding to uPA and PAI-1 mRNA 3′ UTR by chimeric uPA/uPAR)/PAI-1 3′ UTR sequences. A: Schematic diagram shows p53-binding chimeric uPA/uPAR/PAI-1 mRNA 3′ UTR (solid lines) separated by unrelated 10-nucleotide (nt) regions (open lines). B: Purified recombinant p53 protein (purity >95%) was incubated with P-labeled uPA 3′ UTR sequences in the absence (lane 1) or presence of a 200-fold molar excess of unlabeled p53-binding 35-nt uPA 3′ UTR sequence (lane 2), 35-nt non–p53-binding control sequence (lane 3), chimeric p53-binding uPA/uPAR/PAI-1 3′ UTR sequence (lane 4), or chimeric non–p53-binding control uPA/uPAR/PAI-1 3′ UTR sequence (lane 5). The reaction mixtures were digested with RNAse T1 and heparin and subjected to gel mobility shift assay. The reaction mixture contains all of the reagents except recombinant p53 protein (lane 6). C: Recombinant p53 protein was incubated with P-labeled PAI-1 mRNA 3′ UTR sequences in the absence (lane 1) or presence of a 200-fold molar excess of unlabeled p53-binding 70-nt PAI-1 3′ UTR sequence (lane 2), 70-nt non–p53-binding control sequence (lane 3), chimeric p53-binding uPA/uPAR/PAI-1 3′ UTR sequence (lane 4), or chimeric non–p53-binding control uPA/uPAR/PAI-1 3′ UTR sequence (lane 5). The reaction mixtures were digested with RNAse T1 and heparin and subjected to gel mobility shift assay. The reaction mixture contains all of the reagents except recombinant p53 protein (lane 6).
Figure 4
Figure 4
Molecular modeling of the p53 C-terminal domain binding to 3′ UTR of uPA/uPAR/PAI-1 mRNAs. A: The published 3D structure of the C-terminal domain of p53 (Protein Data Bank code 1DT7) is shown as a rendered surface (left) or ribbon (right). The amino acid sequence is indicated with the α-helical portion underlined. The C-terminal domain peptide was docked to the rendered 3D models of the identified UTRs for uPAR (B and C), uPA (D and E), and PAI-1 (F and G). Three different C-terminal domain docking configurations of similar binding energy were identified for the PAI-1 RNA (red, green, and magenta). In all cases, the 2D RNA structures with the lowest energy were first predicted using MC-Fold (B, D, and F). These folded structures were then submitted to MC-Sym (http://www.major.iric.ca/MC-Pipeline) to generate the 3D structures with the lowest energy (C, E, and G), which were used in docking procedures with the C-terminal domain peptide using Autodock Vina (Scripps Research Institute, La Jolla, CA). The web-based MC-Fold and MC-Sym pipeline was provided by the Institute for Research in Immunology and Cancer (University of Montreal, Montreal, QC, Canada).
Figure 5
Figure 5
Effect of chimeric uPA/uPAR/PAI-1 3 UTR sequences on promoter DNA consensus sequence binding and promoter activation by p53 protein. A: Stable H1299 cells expressing vector pcDNA3.1 alone or p53 cDNA in pcDNA3.1 were immunoblotted for p53 and β-actin proteins. B: Protein extracts (20 μg per lane) from stable H1299 cells expressing pcDNA3.1 (lane 1) or p53 cDNA in pcDNA3.1 (lane 2) were subjected to gel mobility shift assay using P-labeled p53 promoter DNA consensus sequence. Free probe reaction mixture lacking protein extracts was incubated with P-labeled p53 promoter DNA consensus sequence (lane 3). The reaction mixtures were separated via electrophoresis on a 5% native polyacrylamide gel with 0.25× Tris-borate-EDTA running buffer and autoradiographed. C: Protein extracts containing recombinant p53 protein (isolated from H1299 cells stably expressing p53 cDNA) were incubated with 1 × 10⁵ cpm P-labeled p53 promoter DNA consensus sequence in the absence (lane 1) or presence of 50-fold excess of unlabeled p53 consensus sequence (lane 2), 50-fold excess chimeric p53-binding sequence (lane 3), or chimeric non–p53-binding (lane 4) uPA/uPAR/PAI-1 3′ UTR sequences or Free probe (lane 5). The p53 protein and P-labeled promoter DNA complexes were separated on a 5% native polyacrylamide gel and autoradiographed. D: H1299 cell extracts containing 20 μg recombinant protein were incubated with 1 × 10⁵ cpm P-labeled p53 promoter DNA consensus sequence in the absence (lane 1) or presence (lanes 2, 3, and 4, respectively) of 100-, 200-, or 300-fold excess of unlabeled chimeric p53-binding 3′ UTR sequences, 50-fold excess of unlabeled p53 consensus sequence (lane 5), or Free probe (lane 6). Samples were subjected to gel mobility shift assay and autoradiographed. E: Stable H1299 cells expressing pcDNA3.1 vector control or p53 cDNA in pcDNA3.1 were transiently transfected with p53-binding promoter sequence construct containing a luciferase reporter gene (5′prom-Luc) alone or 5′prom-Luc co-transfected with chimeric p53-binding or non–p53-binding control sequences overnight in serum medium. These cells were lyzed in lysis buffer, and luciferase activity was measured using a chemiluminescence assay. Differences between treatments are statistically significant (***P < 0.0005) versus vector control.
Figure 6
Figure 6
Expression of p53-binding uPA/uPAR/PAI-1 3′ UTR sequences or luciferase gene in mouse lung ATII cells. A: Schematic diagrams show lentivirus vector harboring SP-B promoter expressing p53-binding chimeric uPA/uPAR/PAI-1 3′ UTR sequence or luciferase (Luc) gene. CMV = cytomegalovirus; R = R sequence; U5 = U5 region. Lentivirus expressing luciferase under SP-B promoter control were injected into mice via orbital plexus, and luciferase expression in lung sections and ATII cell lysates at 72 hours after transduction were analyzed via immunohistochemical staining (B), Western blotting (C), or chemiluminescent assay (D). ***P < 0.005 compared with cells from mice injected with nonrecombinant lentivirus. E: Mice were administered lentivirus vector harboring SP-B promoter expressing p53 binding or non–p53-binding control chimeric uPA/uPAR/PAI-1 3′ UTR mRNA sequences via orbital plexus and after 24 hours were exposed to saline solution or BLM. Mice were sacrificed at 72 hours after BLM treatment. Total RNA isolated from ATII cells was analyzed for uPA and PAI-1 mRNAs via reverse transcription-PCR. Data are given as means ± SD (n = 3 mice per group). The differences between treatments are statistically significant. *P < 0.05. F: Expression of p53-binding uPA/uPAR/PAI-1 3′ UTR mRNA in ATII cells of mice with BLM-induced acute lung injury inhibits the p53 interaction with endogenous uPA/uPAR/PAI-1 mRNAs. ATII cell lysates from mice injected with lentivirus expressing p53-binding or non–p53 binding control sequences and treated with BLM for 72 hours were immunoprecipitated (IP) with anti-p53 antibody. Total RNA from p53 immune complexes were analyzed for uPA/uPAR/PAI-1 mRNAs via reverse transcription-PCR using P–deoxycytidine triphosphate. PCR products were resolved on urea or polyacrylamide gel and exposed to X-ray film.
Figure 7
Figure 7
p53-binding chimeric sequence reverses BLM-induced changes in ATII cell uPA, p53, and PAI-1 expression and apoptosis in vivo. A: H441 cells transduced with lentiviral vector containing p53-binding or non–p53-binding sequences were treated with BLM for 24 hours, and p53, uPA, PAI-1, and cleaved and total caspase-3 levels (Clvd Csp-3 and T-Csp-3, respectively) were determined via Western blotting. β-Actin levels in cell lysates were determined to assess for loading differences. B: Mice were injected with lentivirus (LV) expressing p53 binding or non–p53 binding control chimeric uPA/uPAR/PAI-1 3′ UTR mRNA sequences via orbital plexus, exposed to saline solution or BLM after 24 hours, and sacrificed after 72 hours. ATII cell lysates were analyzed for p53, uPA, PAI-1, cleaved and total caspase-3, and β-actin via Western blotting. MDM2, Bax, and β-actin levels were analyzed to evaluate whether expression of either p53-binding or control non-binding sequences affect p53 transcriptional activity. Lung sections from mice injected with lentivirus were subjected to immunohistochemical staining for PAI-1 (C), TUNEL staining (D), immunofluorescence staining for cleaved caspase-3, and SP-C for assessment of ATII cell apoptosis (E). F: Mice were subjected to i.t. injection of lentivirus expressing p53-binding or non-binding control chimeric uPA/uPAR/PAI-1 3′ UTR mRNA sequences and after 24 hours were exposed to saline solution or BLM. Mice were sacrificed at 72 hours after BLM injury. Lysates from isolated ATII cells were analyzed for p53, uPA, PAI-1, cleaved and total caspase-3, and β-actin via Western blotting. G: Lung sections from mice described in Figure 7F were subjected to TUNEL staining. C, D, and G: ×400 magnification.
Figure 8
Figure 8
Inhibition of BLM-induced lung fibrosis in mice via administration of the chimeric p53-binding 3′ UTR sequences. A: Mice were injected with lentivirus expressing p53 binding or nonbinding control chimeric uPA/uPAR/PAI-1 3′ UTR mRNA sequences via orbital plexus and 24 hours later were treated with saline solution or BLM. Lung sections from mice were subjected to trichrome staining. Blue stain indicates deposition of collagen, fibronectin, and other matrix proteins. Panel A (×400 magnification) is representative of nine fields per mouse (n = 3 mice per group). B: Lung homogenates from mice exposed to saline solution or BLM were analyzed for hydroxyproline content. Data are given as means ± SD of at least three repetitions (n = 3 mice per group). Differences between treatments are statistically significant (*P < 0.05, ***P < 0.005). C: Mice were exposed to BLM for 72 hours to induce lung injury and later were injected with lentivirus expressing p53-binding or non-binding control chimeric uPA/uPAR/PAI-1 3′ UTR mRNA sequences via orbital plexus. Mice were sacrificed on day 21, and lung sections were subjected to trichrome staining. Panel C (×400 magnification) is representative of nine fields per mouse (n = 3 mice per group). D: Lung homogenates from mice exposed to BLM and p53-binding or control non-binding 3′ UTR sequences as described in Figure 8C were analyzed for hydroxyproline content. Shaded columns represent means ± SD of at least three repetitions (n = 3 mice per group). Differences between treatments are statistically significant (**P < 0.05, ***P < 0.005).
Figure 9
Figure 9
Protection against BLM-induced ATII cell apoptosis and pulmonary fibrosis by the chimeric p53 binding sequences does not require uPA expression. A: uPA-deficient mice were i.v. injected with lentivirus expressing p53-binding or non-binding control chimeric uPA/uPAR/PAI-1 3′ UTR mRNA sequences and after 24 hours were treated with saline solution or BLM, and ATII cells were isolated at 72 hours after BLM treatment. Levels of cleaved and total caspase-3 (Clvd Csp-3 and T-Csp-3, respectively), PAI-1, p53, and β-actin were determined via Western blotting. B: Levels of PAI-1 and β-actin mRNAs in ATII cells were determined via reverse transcription-PCR. Lung sections of uPA-deficient mice exposed to BLM were subjected to TUNEL (C) and immunofluorescence staining (D) for cleaved caspase-3 (green) and SP-C (red) to assess ATII cell apoptosis. Representative sections from three mice are shown at ×400 magnification. E: Mice were i.v. injected with lentivirus expressing p53-binding or non–p53-binding control chimeric uPA/uPAR/PAI-1 3′ UTR mRNA sequences and after 24 hours were treated with BLM. Mice were sacrificed at 21 days after treatment with BLM. Lung sections were subjected to trichrome staining. Panels are representative of nine fields per mouse (n = 3 mice per group) and shown at ×400 magnification. F: Mouse lung homogenates were analyzed for changes in hydroxyproline content. Data are shown as means ± SD of at least three repetitions (n = 3 mice per group). The differences between treatments are statistically significant (*P < 0.05).
Figure 10
Figure 10
PAI-1– and p53-deficient mice resist ATII cell apoptosis. Lung sections of PAI-1– and p53-deficient mice expressing p53-binding or non-binding control chimeric uPA/uPAR/PAI-1 3′ UTR sequences were treated with BLM for 72 hours and subjected to TUNEL staining. TUNEL-positive cells were counted in high-power field (HPF) to assess apoptosis (n = 3 mice per group). Mice exposed to saline solution served as controls.

Similar articles

Cited by

References

    1. Bhandary Y.P., Shetty S.K., Marudamuthu A.S., Gyetko M.R., Idell S., Gharaee-Kermani M., Shetty R.S., Starcher B.C., Shetty S. Regulation of alveolar epithelial cell apoptosis and pulmonary fibrosis by coordinate expression of components of the fibrinolytic system. Am J Physiol Lung Cell Mol Physiol. 2012;302:L463–L473. - PMC - PubMed
    1. Shetty S.K., Bhandary Y.P., Marudamuthu A.S., Abernathy D., Velusamy T., Starcher B., Shetty S. Regulation of airway and alveolar epithelial cell apoptosis by p53 induced plasminogen activator inhibitor-1 during cigarette smoke exposure injury. Am J Respir Cell Mol Biol. 2012;47:474–483. - PMC - PubMed
    1. Rammah M., Dandachi F., Salman R., Shihadeh A., El-Sabban M. In vitro cytotoxicity and mutagenicity of mainstream waterpipe smoke and its functional consequences on alveolar type II derived cells. Toxicol Lett. 2012;211:220–231. - PMC - PubMed
    1. Shetty P., Velusamy T., Bhandary Y.P., Shetty R.S., Liu M.C., Shetty S. Urokinase expression by tumor suppressor protein p53: a novel role in mRNA turnover. Am J Respir Cell Mol Biol. 2008;39:364–372. - PMC - PubMed
    1. Shetty S., Velusamy T., Idell S., Shetty P., Mazar A.P., Bhandary Y.P., Shetty R.S. Regulation of urokinase receptor expression by p53: novel role in stabilization of uPAR mRNA. Mol Cell Biol. 2007;27:5607–5618. - PMC - PubMed

Publication types

MeSH terms