. 2013 Jun;16(6):756-62.
doi: 10.1038/nn.3398. Epub 2013 May 12.

Selective and graded coding of reward uncertainty by neurons in the primate anterodorsal septal region

Affiliations

Selective and graded coding of reward uncertainty by neurons in the primate anterodorsal septal region

Ilya E Monosov et al. Nat Neurosci. 2013 Jun.

Abstract

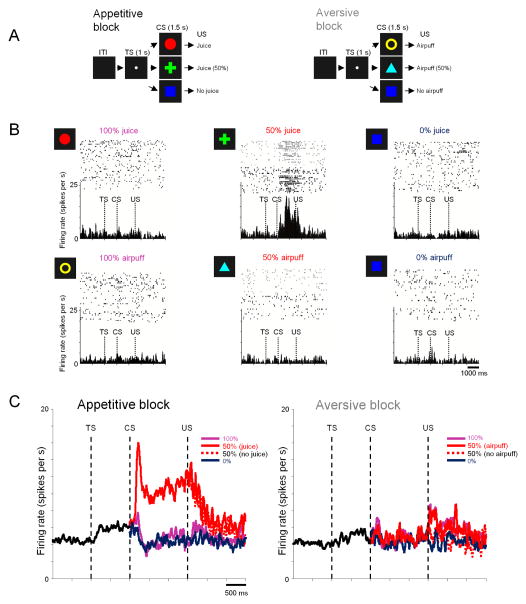
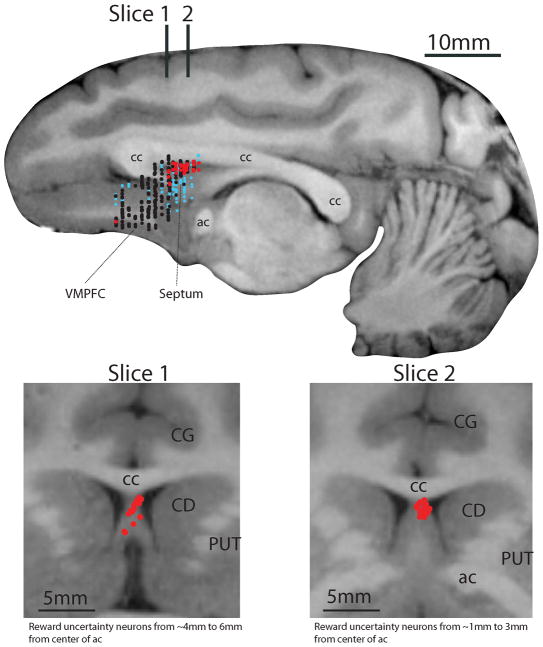
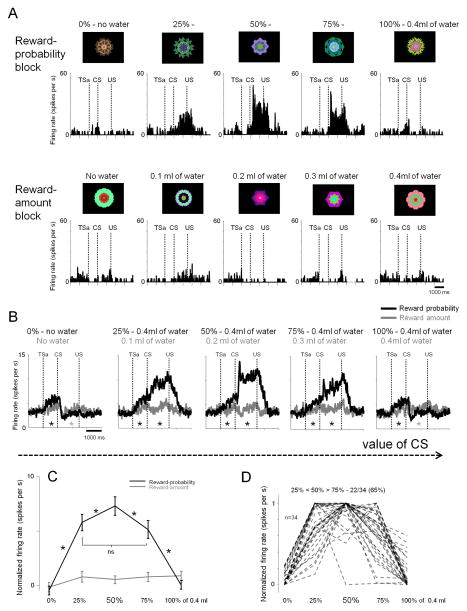
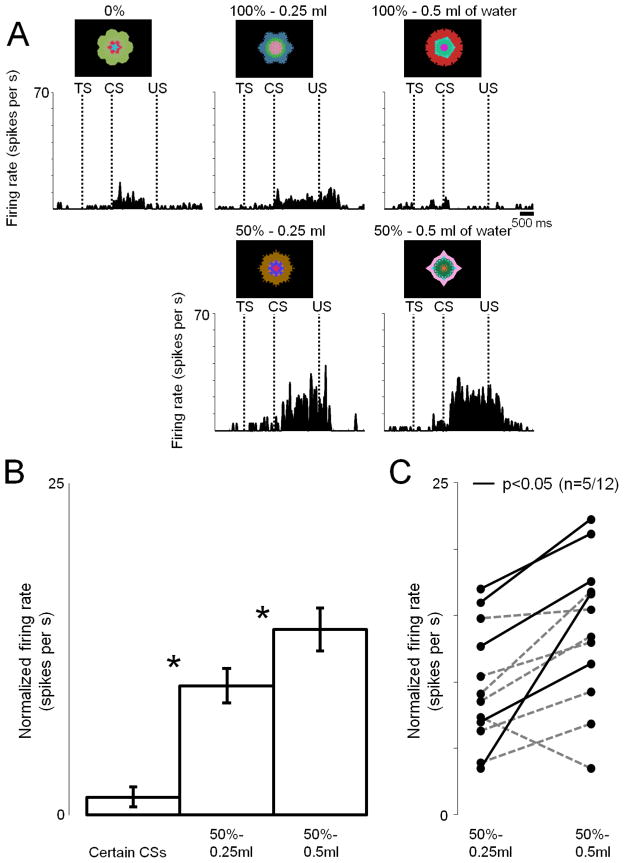
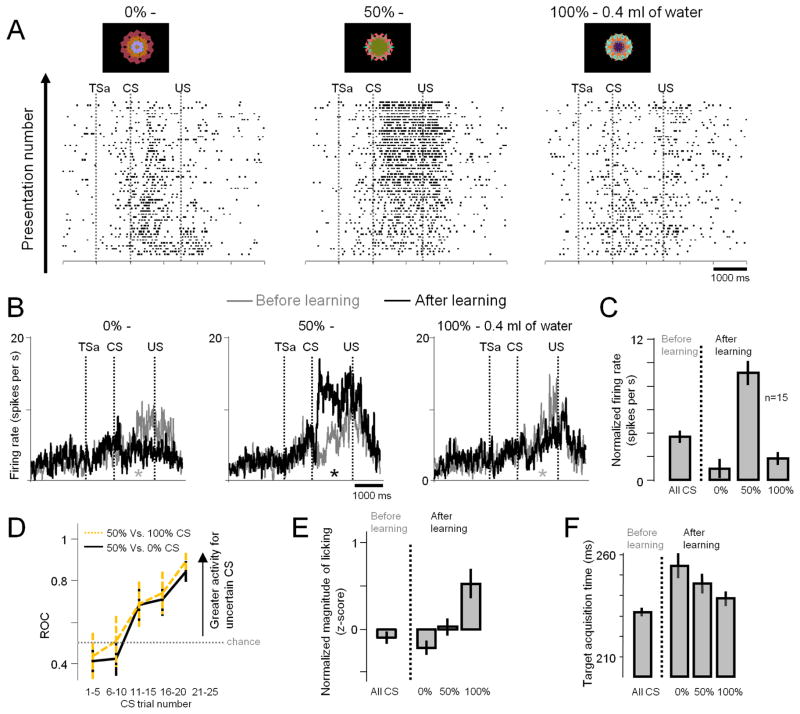
Natural environments are uncertain. Uncertainty of emotional outcomes can induce anxiety and raise vigilance, promote and signal the opportunity for learning, modulate economic choice and regulate risk-seeking. Here we demonstrate that a subset of neurons in the anterodorsal region of the primate septum (ADS) are primarily devoted to processing uncertainty in a highly specific manner. Those neurons were selectively activated by visual cues indicating probabilistic delivery of reward (for example, 25%, 50% and 75% reward) and did not respond to cues indicating certain outcomes (0% and 100% reward). The average ADS uncertainty response was graded with the magnitude of reward uncertainty and selectively signaled uncertainty about rewards rather than punishments. The selective and graded information about reward uncertainty encoded by many neurons in the ADS may underlie modulation of uncertainty of value- and sensorimotor-related areas to regulate goal-directed behavior.


Figures

Figure 1
Figure 1. Responses of reward uncertainty neurons in the anterodorsal septal region (ADS) to certain and uncertain predictions of rewards and punishment (Experiment 1)
(A) Monkeys (B, S, and T) experienced 2 distinct blocks: an appetitive block in which three visual conditioned stimuli (CSs) predicted juice with 100, 50, and 0% probabilities, and an aversive block in which three cues predicted air-puffs with 100, 50, and 0% probabilities. Juice and airpuffs were used as the US in the appetitive (left) and aversive (right) blocks, respectively. ITI: inter-trial-interval, TS: trial start. (B) Rasters showing the activity of a single neuron in two blocks, for each CS separately. Gray rasters indicate the activity in 50% CS trials in which US was omitted. Spike density functions for the same neuron are shown below the rasters. (C) Average activity of uncertainty selective neurons in the ADS (red dots in Figure S4) in the appetitive (left) and aversive (right) block recorded in monkeys B, S, and T.
Figure 2
Figure 2. Locations of neurons tested for uncertainty coding
Top: Estimated locations of 458 neurons (monkeys B, P, S, and T) plotted on a parasagittal MR image from Monkey B. Red dots: reward uncertainty neurons (n=22 from Experiment 1 and n=34 from Experiment 2); no punishment uncertainty neurons were found; black dots: neurons that were not selective to outcome uncertainty (n=297; Experiment 1); small light blue dots: encountered neurons that were not judged to be sensitive to outcome uncertainty without full examination (n=105). VMPFC: ventromedial prefrontal cortex; cc: corpus callosum; ac: anterior commissure. Bottom: Estimated locations of reward uncertainty neurons in the ADS plotted on two coronal MR images from Monkey B. Their locations are indicated on the parasagittal image at top: 5 mm anterior (slice 1) and 2 mm anterior (slice 2) to the center of the ac. Slice 1 includes neurons recorded in a ~3mm area (6mm from ac to 4mm from ac). Slice 2 includes neurons recorded in a ~3mm area (3mm from ac to 1mm from the ac). CG: cingulate cortex; CD: caudate nucleus, PUT: putamen.
Figure 3
Figure 3. Responses of reward uncertainty neurons to information about reward uncertainty and reward amount (Experiment 2)
(A) Activity of a single neuron across two distinct blocks: a reward-probability block (top) and a reward-amount block (bottom). In the reward-probability block, five fractal CSs indicated five different probabilities of 0.4ml of water, and in the reward-amount block, five other fractal CSs indicated five different amounts of water. Expected values of the CSs in the two blocks were matched. The actual fractals used are shown. TSa: Time when the monkey started fixating the trial start cue after making a saccade to it (trial start cue acquisition time). Otherwise, the labeling conventions are the same as in Fig. 1. (B) Average activity of the population of 34 reward-uncertainty neurons (18 in Monkey B and 16 in Monkey P). Reward probability-block (shown in black) and the reward amount-block (gray). Asterisks indicate significant difference between the spiking activity (not normalized) in the two blocks (paired signed rank test; p<0.05; gray: greater activity in the amount block; black: greater activity in the probability block). (C) Average normalized CSs responses of the same neurons for probability (black) and amount (gray) CSs. Black asterisks indicate significance between CSs. (p<0.05; paired signrank test). (D) CS responses shown individually for the 34 neurons in the probability block (normalized to the maximum CS response; from 0 to 1). Most neurons (65%) had the highest response for the 50% CS. All error bars present standard error (SEM).
Figure 4
Figure 4. Responses of reward uncertainty neurons to uncertainty about different valued outcomes (Experiment 3)
(A) The activity of a single reward-uncertainty selective neuron (same conventions as in Fig. 3) recorded while monkey Sm experienced 5 reward predicting fractal cues: 100% of 0.5ml, 100% of 0.25ml, 50% of 0.5ml, 50% of 0.25ml, and 0ml of juice. (B) The average CS responses (normalized to baseline) of 12 neurons (7 in Monkey Sm and 5 in Monkey P). Asterisks indicate significant differences (p<0.05; paired signed rank test). Error bars represent standard error (SEM). (C) Uncertain CS responses shown individually for 12 neurons in the probability block (normalized to baseline). Black lines indicate sessions with significant difference (p<0.05; ranksum test).
Figure 5
Figure 5. Responses of reward uncertainty neurons during learning of novel conditioned stimuli (Experiment 4)
(A) Rasters show the activity of a single reward uncertainty neuron in Pavlovian-procedure in which three novel fractals were used as CSs associated with 100, 50, and 0% reward probabilities. Presentation number refers to the order in which the monkeys experienced each of the 3 CSs. All figure labels are the same as in Fig. 3. (B) Average CS-responses of the population of 15 reward uncertainty neurons before learning (gray; the first 5 trials in which the CS was experienced) and after learning (black; last five trials in which CS was experienced). Asterisks indicate significant difference between the activity in the before learning and after learning conditions (paired signed rank test; p<0.05; gray: greater activity before learning; black: greater activity after learning). (C) Normalized CS responses (normalization relative to ITI baseline activity) before learning (left; for all CSs) and after learning (right; for 3 CSs separately). (D) Neuronal learning expressed as changes in differential responses between the uncertain (50%) CS and the certain CSs (100%: green; 0%: black). The differential response was measured by an ROC area. Data were based on 9 neurons (6 in Monkey B and 3 in P) for which more than 25 trials were tested for all CSs. (E) Magnitudes of anticipatory licking before learning (left) and after learning (right). The magnitudes of licking after learning were correlated to the values of the CSs (15 sessions; rho=0.32; p<0.0001; permutation test; SEM and correlations calculated from single trial z-scores). (F) Latencies of eye movements before learning (left) and after learning (right). Data was based on monkey B (n=9), because for that monkey on a third of the trials the CSs appeared 10 degrees to the left or the right of the fixation point (Methods). The latency of the eye movement to the CS was measured from the CS onset to the time when the monkey’s gaze was fixated on the CS (target acquisition time). The latencies after learning were inversely correlated to the values of the CSs (9 sessions; rho = −0.2; p < 0.05; permutation test; SEM and correlations calculated from single trial latencies). All error bars represent standard error (SEM).

Comment in

  • The uncertainty of it all.
    Kepecs A. Kepecs A. Nat Neurosci. 2013 Jun;16(6):660-2. doi: 10.1038/nn.3416. Nat Neurosci. 2013. PMID: 23712066 No abstract available.

References

    1. Hirsh JB, Mar RA, Peterson JB. Psychological entropy: A framework for understanding uncertainty-related anxiety. Psychol Rev. 2012;119:304–320. - PubMed
    1. Bach DR, Dolan RJ. Knowing how much you don’t know: a neural organization of uncertainty estimates. Nature reviews. Neuroscience. 2012;13:572–586. doi: 10.1038/nrn3289. - DOI - PubMed
    1. Behrens TE, Woolrich MW, Walton ME, Rushworth MF. Learning the value of information in an uncertain world. Nat Neurosci. 2007;10:1214–1221. - PubMed
    1. Platt ML, Huettel SA. Risky business: the neuroeconomics of decision making under uncertainty. Nat Neurosci. 2008;11:398–403. - PMC - PubMed
    1. Bromberg-Martin ES, Hikosaka O. Midbrain dopamine neurons signal preference for advance information about upcoming rewards. Neuron. 2009;63:119–126. - PMC - PubMed

Publication types