Meta-Analysis
. 2013 Jun;45(6):680-5.
doi: 10.1038/ng.2634. Epub 2013 May 12.

Meta-analysis identifies four new loci associated with testicular germ cell tumor

Affiliations
Meta-Analysis

Meta-analysis identifies four new loci associated with testicular germ cell tumor

Charles C Chung et al. Nat Genet. 2013 Jun.

Abstract

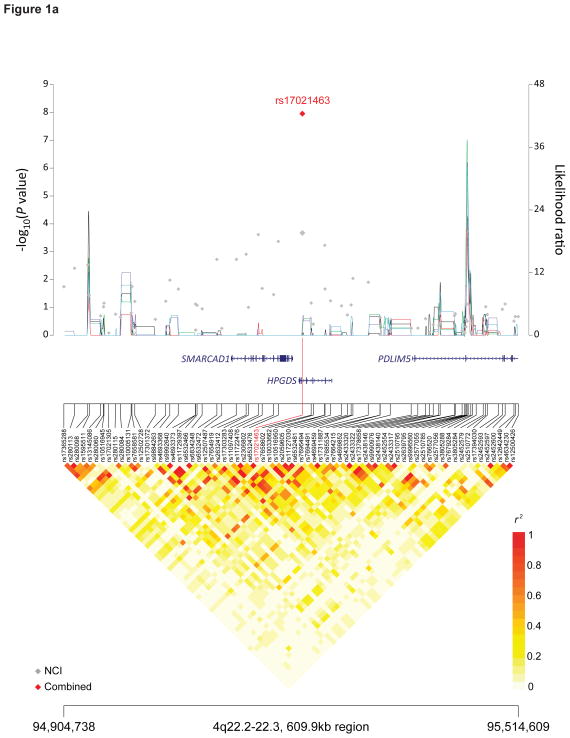
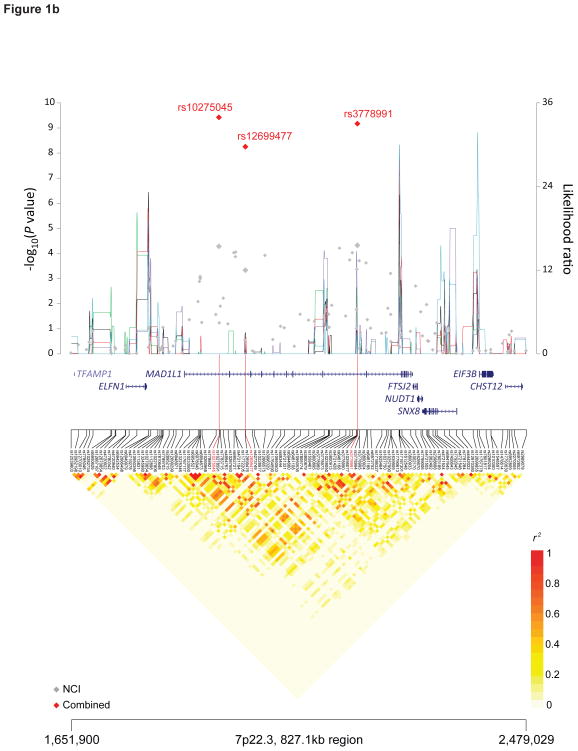
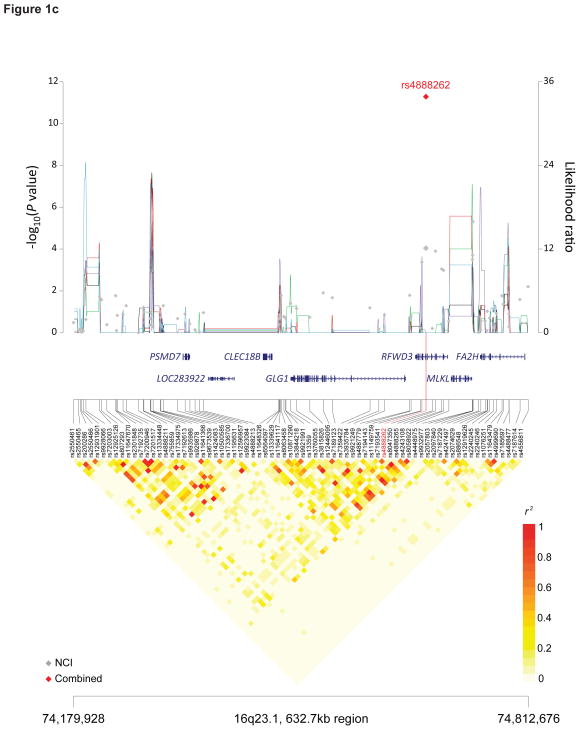
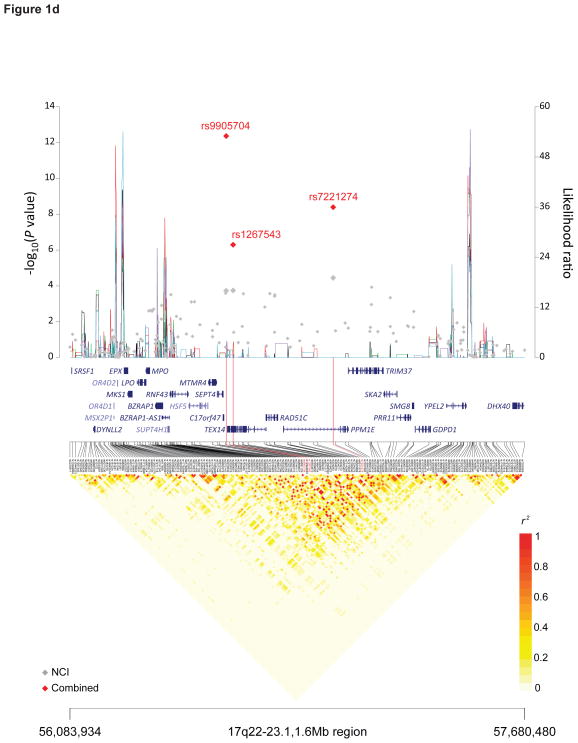
We conducted a meta-analysis to identify new susceptibility loci for testicular germ cell tumor (TGCT). In the discovery phase, we analyzed 931 affected individuals and 1,975 controls from 3 genome-wide association studies (GWAS). We conducted replication in 6 independent sample sets comprising 3,211 affected individuals and 7,591 controls. In the combined analysis, risk of TGCT was significantly associated with markers at four previously unreported loci: 4q22.2 in HPGDS (per-allele odds ratio (OR) = 1.19, 95% confidence interval (CI) = 1.12-1.26; P = 1.11 × 10(-8)), 7p22.3 in MAD1L1 (OR = 1.21, 95% CI = 1.14-1.29; P = 5.59 × 10(-9)), 16q22.3 in RFWD3 (OR = 1.26, 95% CI = 1.18-1.34; P = 5.15 × 10(-12)) and 17q22 (rs9905704: OR = 1.27, 95% CI = 1.18-1.33; P = 4.32 × 10(-13) and rs7221274: OR = 1.20, 95% CI = 1.12-1.28; P = 4.04 × 10(-9)), a locus that includes TEX14, RAD51C and PPM1E. These new TGCT susceptibility loci contain biologically plausible genes encoding proteins important for male germ cell development, chromosomal segregation and the DNA damage response.


Conflict of interest statement

Conflict of Interest

There are no conflicts of interest.

Figures

Figure 1
Figure 1. Recombination plot and linkage disequilibrium structure for the four new TGCT susceptibility regions at 4q22.2, 7p22.3, 16q22.3 and 17q22 (a–d)
Regional plots of association results, recombination hotspots and linkage disequilibrium for the (a) 4q22.2–22.3:94,904,738–95,514,609, (b) 7p22.3:1,651,900–2,479,029, (c) 16q23.1:74,179,928–74,812,676 and (d) 17q22–23.1:56,083,934–57,680,480 TGCT susceptibility loci. (a–d) Combined meta-analysis results are shown as red diamonds with rs numbers labeled, and the NCI scan in gray. For each plot, −log10P values (y axis, left) of the SNPs are shown according to their chromosomal positions (x axis). Linkage disequilibrium structure based on NCI controls (n=1,188) was visualized by snp.plotter software. The line graph shows likelihood ratio statistics (y axis, right) for recombination hotspot by SequenceLDhot software and five different colors represent 5 tests of 100 controls from NCI without resampling. Physical locations of each region are based on NCBI Build 37 of the human genome.

Comment in

References

    1. Rosen A, Jayram G, Drazer M, Eggener SE. Global trends in testicular cancer incidence and mortality. Eur Urol. 2011;60:374–9. - PubMed
    1. Howlader N, et al. SEER Cancer Statistics Review, 1975–2009 (Vintage 2009 Populations) based on November 2011 SEER data submission, posted to the SEER web site, 2012. National Cancer Institute; Bethesda MD: 2012.
    1. Stang A, et al. Gonadal and extragonadal germ cell tumours in the United States, 1973–2007. Int J Androl. 2012;35:616–25. - PMC - PubMed
    1. McGlynn KA, Trabert B. Adolescent and adult risk factors for testicular cancer. Nat Rev Urol. 2012;9:339–49. - PMC - PubMed
    1. Daling JR, et al. Association of marijuana use and the incidence of testicular germ cell tumors. Cancer. 2009;115:1215–23. - PMC - PubMed

Publication types

Supplementary concepts