

Changes in bone resorption across the menopause transition: effects of reproductive hormones, body size, and ethnicity
- PMID: 23666961
- PMCID: PMC3701268
- DOI: 10.1210/jc.2012-4113
Changes in bone resorption across the menopause transition: effects of reproductive hormones, body size, and ethnicity
Erratum in
- J Clin Endocrinol Metab. 2014 May;99(5):1910
Abstract
Objective: Our objective was to characterize changes in bone resorption in relation to the final menstrual period (FMP), reproductive hormones, body mass index (BMI), and ethnicity.
Methods: Urinary type I collagen N-telopeptide (NTX), estradiol, and FSH levels were measured annually for up to 8 years spanning the menopause transition in 918 African American, Chinese, Japanese, or Caucasian women.
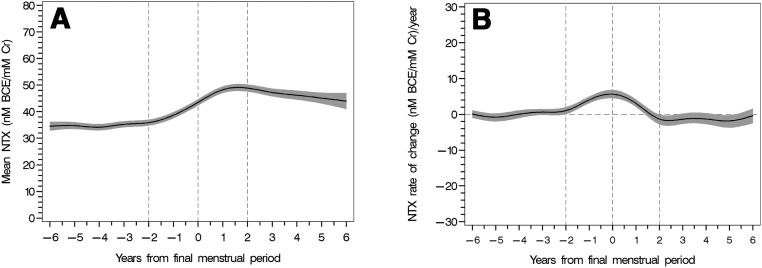
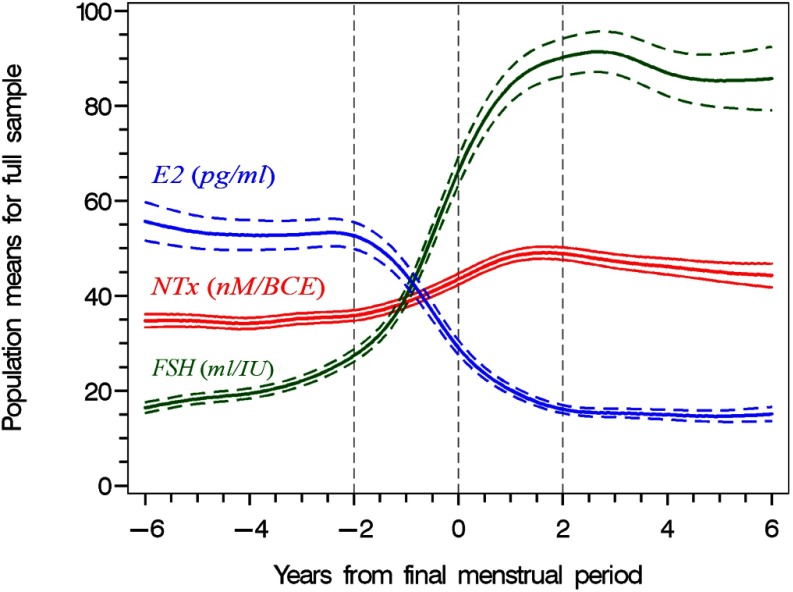
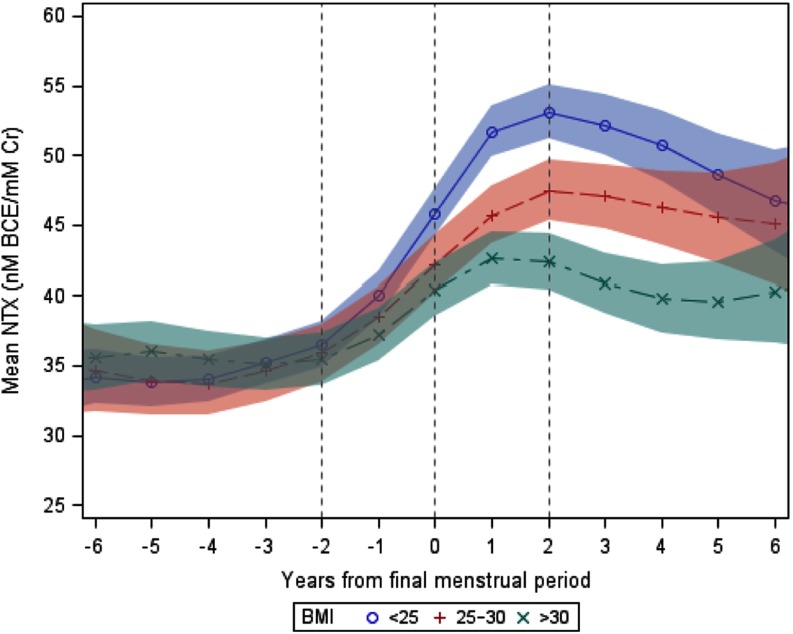
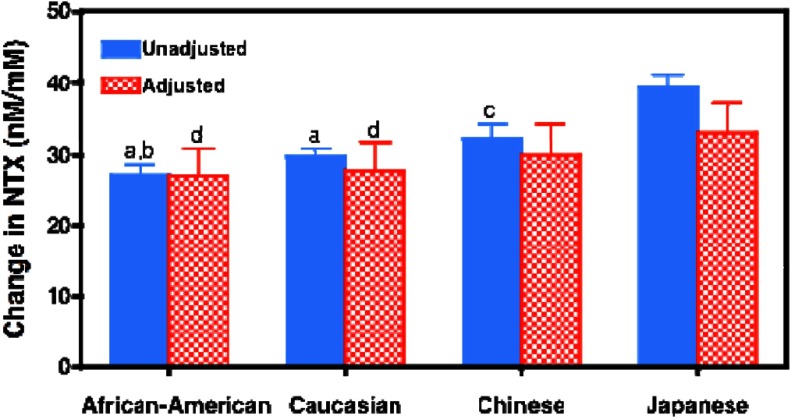
Results: Urinary NTX began to increase sharply about 2 years before the FMP, reaching its peak level about 1 to 1.5 years after the FMP. NTX levels declined modestly from 2 to 6 years after the FMP but remained about 20% higher than before the menopause transition. The sharp rise in FSH occurred in conjunction with a sharp decline in estradiol and shortly after FSH levels began increasing rapidly. The mean increase in urinary NTX across the menopause transition was greatest in women with BMI <25 kg/m² and smallest in women with BMI >30 kg/m². Increases in NTX were greatest in Japanese women and smallest in African Americans. These differences were attenuated, but not eliminated, when analyses were adjusted for covariates, particularly BMI.
Summary: During the menopause transition, a decline in ovarian function beginning about 2 years before the FMP is followed by an increase in bone resorption and subsequently by bone loss. The magnitude of the increase in bone resorption is inversely associated with BMI. Ethnic differences in changes in bone resorption are attenuated, but not eliminated, by adjustment for BMI. Ethnic differences in BMI, and corresponding ethnic differences in bone resorption, appear to account for much of the ethnic variation in perimenopausal bone loss.
Figures
Comment in
-
Changes in bone resorption during the menopause transition.Climacteric. 2013 Dec;16(6):724-5. Climacteric. 2013. PMID: 24383094 No abstract available.
References
-
- Ebeling PR, Atley LM, Guthrie JR, B, et al. Bone turnover markers and bone density across the menopausal transition. J Clin Endocrinol Metab. 1996;81:3366–3371 - PubMed
-
- Garnero P, Shih WJ, Gineyts E, Karpf DB, Delmas PD. Comparison of new biochemical markers of bone turnover in late postmenopausal osteoporotic women in response to alendronate treatment. J Clin Endocrinol Metab. 1994;79:1693–1700 - PubMed
-
- Garnero P, Sornay-Rendu E, Chapuy MC, Delmas PD. Increased bone turnover in late postmenopausal women is a major determinant of osteoporosis. J Bone Miner Res. 1996;11:337–349 - PubMed
-
- Gorai I, Taguchi Y, Chaki O, Nakayama M, Minaguchi H. Specific changes of urinary excretion of cross-linked N-telopeptides of type I collagen in pre- and postmenopausal women: correlation with other markers of bone turnover. Calcif Tissue Int. 1997;60:317–322 - PubMed
Publication types
MeSH terms
Substances
Grants and funding
- U01AG012535/AG/NIA NIH HHS/United States
- U01 AG012554/AG/NIA NIH HHS/United States
- U01AG012546/AG/NIA NIH HHS/United States
- U01AG012495/AG/NIA NIH HHS/United States
- U01AG012531/AG/NIA NIH HHS/United States
- U01AG012505/AG/NIA NIH HHS/United States
- U01AG012539/AG/NIA NIH HHS/United States
- U01AG017719/AG/NIA NIH HHS/United States
- U01 AG012495/AG/NIA NIH HHS/United States
- U01 AG012505/AG/NIA NIH HHS/United States
- U01NR004061/NR/NINR NIH HHS/United States
- U01AG012553/AG/NIA NIH HHS/United States
- U01 AG012535/AG/NIA NIH HHS/United States
- U01 AG012553/AG/NIA NIH HHS/United States
- U01 NR004061/NR/NINR NIH HHS/United States
- U01 AG012539/AG/NIA NIH HHS/United States
- U01AG012554/AG/NIA NIH HHS/United States
- U01 AG012546/AG/NIA NIH HHS/United States
- U01 AG012531/AG/NIA NIH HHS/United States
- U01 AG017719/AG/NIA NIH HHS/United States
LinkOut - more resources
Full Text Sources
Other Literature Sources
Medical
Molecular Biology Databases
