. 2013 Jun 15;190(12):6115-25.
doi: 10.4049/jimmunol.1203302. Epub 2013 May 10.

Viral antigen induces differentiation of Foxp3+ natural regulatory T cells in influenza virus-infected mice

Affiliations

Viral antigen induces differentiation of Foxp3+ natural regulatory T cells in influenza virus-infected mice

Felipe Bedoya et al. J Immunol. .

Abstract

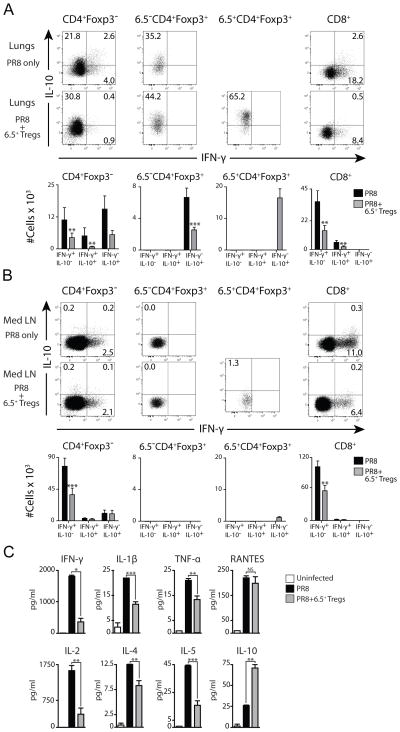
We examined the formation, participation, and functional specialization of virus-reactive Foxp3(+) regulatory T cells (Tregs) in a mouse model of influenza virus infection. "Natural" Tregs generated intrathymically, based on interactions with a self-peptide, proliferated in response to a homologous viral Ag in the lungs and, to a lesser extent, in the lung-draining mediastinal lymph nodes (medLNs) of virus-infected mice. In contrast, conventional CD4(+) T cells with identical TCR specificity underwent little or no conversion to become "adaptive" Tregs. The virus-reactive Tregs in the medLNs and the lungs of infected mice upregulated a variety of molecules associated with Treg activation, as well as acquired expression of molecules (T-bet, Blimp-1, and IL-10) that confer functional specialization to Tregs. Notably, however, the phenotypes of the T-bet(+) Tregs obtained from these sites were distinct, because Tregs isolated from the lungs expressed significantly higher levels of T-bet, Blimp-1, and IL-10 than did Tregs from the medLNs. Adoptive transfer of Ag-reactive Tregs led to decreased proliferation of antiviral CD4(+) and CD8(+) effector T cells in the lungs of infected hosts, whereas depletion of Tregs had a reciprocal effect. These studies demonstrate that thymically generated Tregs can become activated by a pathogen-derived peptide and acquire discrete T-bet(+) Treg phenotypes while participating in and modulating an antiviral immune response.


Conflict of interest statement

The authors declare no financial conflicts of interest.

Figures

FIGURE 1
FIGURE 1
CD4+CD25+Foxp3+ Tregs localize to the sites of influenza virus infection. (A) Dot plots show Foxp3 versus CD25 expression by CD4+ cells obtained from the medLN, lungs and BAL of BALB/c mice 8 d p.i. with PR8 virus. Percentages of cells in the indicated quadrants are shown. Data is representative of at least 3 independent experiments; n≥6. (B) Numbers of CD4+CD25+Foxp3+ cell numbers isolated from the lungs, BAL, spleen and peripheral and mediastinal LN of uninfected (Uninf) and PR8-infected BALB/c mice at 5, 8 and 12 d p.i.. Bars indicate mean±SEM; n=6–10. Statistical analysis of total Treg numbers was performed using a one-way ANOVA followed by Dunnett’s post-test for multiple comparison with reference to uninfected controls. *p-value<0.05, **p-value<0.01.
FIGURE 2
FIGURE 2
Thymically-derived virus-reactive Foxp3+ regulatory T cells participate in anti-influenza virus immunity. (A) Diagrammatic representation of experimental model. Briefly, 6.5+CD4+CD25+ eGFP+ FACS-sorted cells from TS1xHA28.Foxp3eGFP mice (termed 6.5+Foxp3(eGFP)+ Tregs), or 6.5+CD4+eGFP cells from TS1.Foxp3eGFP mice were adoptively transferred into BALB/c mice. Mice were i.n. infected with PR8 virus and tissues were analyzed by flow cytometry. (B) Dot plots show GFP(Foxp3) versus 6.5 expression by CD4+ cells isolated from the indicated tissues 8 d p.i. with PR8 virus, in BALB/c mice that had received either 6.5+Foxp3(eGFP)+ Tregs (top row) or 6.5+Foxp3(eGFP) cells (bottom row). Percentages of cells in the indicated quadrants are shown. Data is representative of 3 separate experiments, n=6–9. (C) Graph shows percentages of 6.5+CD4+Foxp3(eGFP)+ cells in CD4+ cells isolated from indicated tissues 8 d p.i. with PR8 virus, in BALB/c mice that had received CD4+CD8Foxp3(eGFP)+ thymocytes from 5 week-old TS1xHA28.Foxp3(eGFP) mice. Bars indicate means, n=3. (D) Dot plots show Foxp3 versus 6.5 staining of CD4+ cells from the medLN and lungs of mice 8 d p.i. with either PR8 virus (H1N1) or J1 virus (H3N1), in BALB/c mice that had received 6.5+Foxp3(eGFP)+ Tregs. Percentages of cells in the indicated quadrants are shown. Data is representative of 2 independent experiments, n=3. (E) Dot plots show 6.5 versus Ki-67 expression by CD4+Foxp3+ cells from the medLN and lungs from uninfected BALB/c mice, from uninfected TS1xHA28 mice, from BALB/c mice 8 d p.i. with PR8 virus, and from BALB/c mice that had received 6.5+Foxp3(eGFP)+ Tregs, 8 d p.i. with PR8 virus. Percentages of cells in the indicated quadrants are shown. Data is representative of 3 independent experiments, n≥3. (F) Dot plots show Foxp3 versus 6.5 expression by CD4+ cells obtained from the medLN and lungs 8 d p.i. with PR8 virus, in mice that had received 6.5+Foxp3(eGFP)+ Tregs. Cells were electronically gated into three subsets; 6.5+Foxp3+ Tregs (green boxes), “endogenous” 6.5Foxp3+ Tregs (blue boxes), and “conventional” CD4+Foxp3 T cells (red boxes). Histograms show cell surface expression of indicated molecules by these different subsets, with line colors corresponding to those of the electronically gated subsets. Figures are representative of three or more independent experiments; n=6–10.
FIGURE 3
FIGURE 3
Virus-reactive Tregs downmodulate the accumulation of effector T cells in the lungs of influenza infected mice. (A) Dot plots show CD4 versus CD8 expression in the lungs and medLN of d 8 p.i. of PR8-infected BALB/c mice that had or had not received 6.5+Foxp3(eGFP)+ Tregs. Numbers indicate mean percentages. Graphs indicate cell numbers, with bars representing mean±SEM, n≥3. *p-value<0.05. Data are representative of at least 3 independent experiments. (B) Dot plots show CD44 versus H2-Kd:NP147 expression by CD8+ cells in the lungs, BAL and medLN of d 8 p.i. of PR8-infected BALB/c mice that had or had not received 6.5+Foxp3(eGFP)+ Tregs. Also shown is CD44 versus H2-Kd:AMQ expression on cells from PR8-infected mice (staining control). Numbers indicate mean percentages. Graphs indicate cell numbers, with bars representing mean±SEM, n≥3. **p-value<0.03. Data are representative of at least 3 independent experiments. (C) Graph shows viral titer kinetics in the lungs of PR8-infected BALB/c mice that had or had not received 6.5+Foxp3(eGFP)+ cells. Shown mean±SEM per time point analyzed, n=3–6. *p-value<0.05. Data are representative of 2 independent experiments. (D) Dot plots show CD4 versus CD8 expression in the lungs and medLN of d 8 p.i. of PR8-infected BALB/c mice that were or were not treated with anti-CD25 mAb (PC-61). Numbers indicate mean percentages. Graphs indicate cell numbers, with bars representing mean±SEM, n≥3. *p-value<0.05. Data are representative of at least 2 independent experiments. (E) Representative H&E-stained lung sections of uninfected and PR8-infected mice that received 6.5+Foxp3(eGFP)+ Tregs, PC-61 and/or virus. Bars, 200 μm. Graph shows percentages of leukocyte-infiltrated areas over total lung area for the three conditions indicated as determined by morphometric analysis of sections obtained from entire lung lobes. Each dot represents a mouse. Data are representative of two independent experiments. A one-way ANOVA with Bonferroni’s post-test was performed to determine statistical significance between groups of samples, **p-value<0.01, ***p-value<0.001.
FIGURE 4
FIGURE 4
Virus-reactive Tregs produce IL-10 preferentially in the lungs and suppress CD4+ and CD8+ effector T cells. (A) Dot plots show IL-10 versus IFN-γ staining of indicated T-cell subsets from the lungs d 8 p.i. of PR8-infected BALB/c mice that had or had not received 6.5+Foxp3(eGFP)+ Tregs. Numbers represent mean percentage of cytokine-producing cells (n=3). Graphs indicate numbers of cells of each phenotype; bars represent mean±SEM. n=3, **p-value<0.03, ***p-value<0.01. Data are representative of 4 independent experiments. (B) Same as (A), but for medLN. (C) Cytokine levels in serum of uninfected BALB/c mice, and from d 8 PR8-infected mice that did or did not receive 6.5+Foxp3(eGFP)+ Tregs. Bar indicates mean±SEM; n=6–10. *p-value<0.05, **p-value<0.03, ***p-value<0.01.
FIGURE 5
FIGURE 5
Virus-reactive Tregs acquire a T-bet+ Treg transcriptional program with IL-10 production in the lungs of influenza-infected mice. (A) Histograms show CXCR3, T-bet and IL-10 levels in 6.5+CD4+Foxp3+ cells obtained either from the lungs (green lines) or medLN (black lines) d 8 p.i. PR8-infected BALB/c mice that had received 6.5+Foxp3(eGFP)+ Tregs, or from uninfected TS1xHA28 donor mice (gray lines). Graphs indicate MFI of each population. Bars indicate mean±SEM; n≥3, *p-value<0.05, **p-value<0.03, ***p-value<0.01. Data are representative of 4 independent experiments. (B) Real-time qRT-PCR analysis of mRNA levels in 6.5+Foxp3(eGFP)+ cells that had been FACS-purified from lungs (black bars) or medLN (white bars) of d 8 p.i. PR8-infected BALB/c mice that had received 6.5+Foxp3(eGFP)+ Tregs. Data are shown relative to expression levels in 6.5+Foxp3(eGFP)+ Tregs purified from donor TS1xHA28 mice using the ΔΔCT quantitative method (41). All samples were normalized to Gapdh expression levels, bars indicate mean±SEM, n=3; **p-value<0.03, ***p-value<0.01. (C) As for (A), but for polyclonal CD4+Foxp3+ cells from PR8 virus infected mice that did not receive 6.5+Foxp3(eGFP)+ Tregs. In this case levels are shown relative to an isotype control. (D) As for (A), except for 6.5+CD4+Foxp3+ (green lines) versus 6.5CD4+Foxp3(eGFP)+ (blue lines) cells from lungs. Data are representative of three independent experiments with n≥3. Bars represent mean±SEM. *p-value<0.05, **p-value<0.03, ***p-value<0.01. Levels are shown relative to an isotype control. (E) Dot plot shows electronic gating used to purify 6.5+Foxp3(eGFP)+ cells (“6.5+ Tregs”) and 6.5Foxp3(eGFP)+ cells (“Endogenous Tregs”) from lungs of PR8-infected BALB/c.Foxp3eGFP mice that had received 6.5+Foxp3(eGFP)+ Tregs. Graph shows relative expression of Tbx21 and Prdm1 mRNAs determined by real-time qPCR (n=3). Bars represent mean±SEM. Statistical significance was determined using a one-way ANOVA with Bonferroni’s post-test or unpaired Student’s t-test analyses when either multiple or dual comparison of the groups was required. *p-value<0.05, **p-value<0.01, ***p-value<0.001.
FIGURE 6
FIGURE 6
Virus-reactive T-bet+ Tregs suppress proliferation of effector T cells in the lungs of infected mice. (A) Histograms show Ki-67 expression by indicated T-cell subsets isolated from the lungs and medLN of d 8 p.i. PR8-infected BALB/c mice that had or had not received 6.5+Foxp3(eGFP)+ Tregs. Numbers indicate mean percentages; n≥3. **p-value<0.03, ***p-value<0.01. Data are representative of at least 3 independent experiments. (B) Same as (A), but for medLN. (C) Histograms show CXCR3 expression by indicated T-cell subsets isolated from the medLN of d 8 p.i. PR8-infected BALB/c mice that had or had not received 6.5+Foxp3(eGFP)+ Tregs. Numbers indicate mean percentages; n≥3. Data are representative of at least 3 independent experiments.

References

    1. Shevach EM. Biological functions of regulatory T cells. Adv Immunol. 2011;112:137–176. - PubMed
    1. Sakaguchi S, Sakaguchi N, Asano M, Itoh M, Toda M. Immunologic self-tolerance maintained by activated T cells expressing IL-2 receptor alpha-chains (CD25). Breakdown of a single mechanism of self-tolerance causes various autoimmune diseases. J Immunol. 1995;155:1151–1164. - PubMed
    1. Kim JM, Rasmussen JP, Rudensky AY. Regulatory T cells prevent catastrophic autoimmunity throughout the lifespan of mice. Nat Immunol. 2007;8:191–197. - PubMed
    1. Belkaid Y, Tarbell K. Regulatory T cells in the control of host-microorganism interactions. Annu Rev Immunol. 2009;27:551–589. - PubMed
    1. Wohlfert E, Belkaid Y. Role of endogenous and induced regulatory T cells during infections. J Clin Immunol. 2008;28:707–715. - PMC - PubMed

Publication types

MeSH terms