. 2013 Jul 5;288(27):19830-44.
doi: 10.1074/jbc.M112.411686. Epub 2013 May 10.

Structure-based discovery of antagonists of nuclear receptor LRH-1

Affiliations

Structure-based discovery of antagonists of nuclear receptor LRH-1

Cindy Benod et al. J Biol Chem. .

Abstract

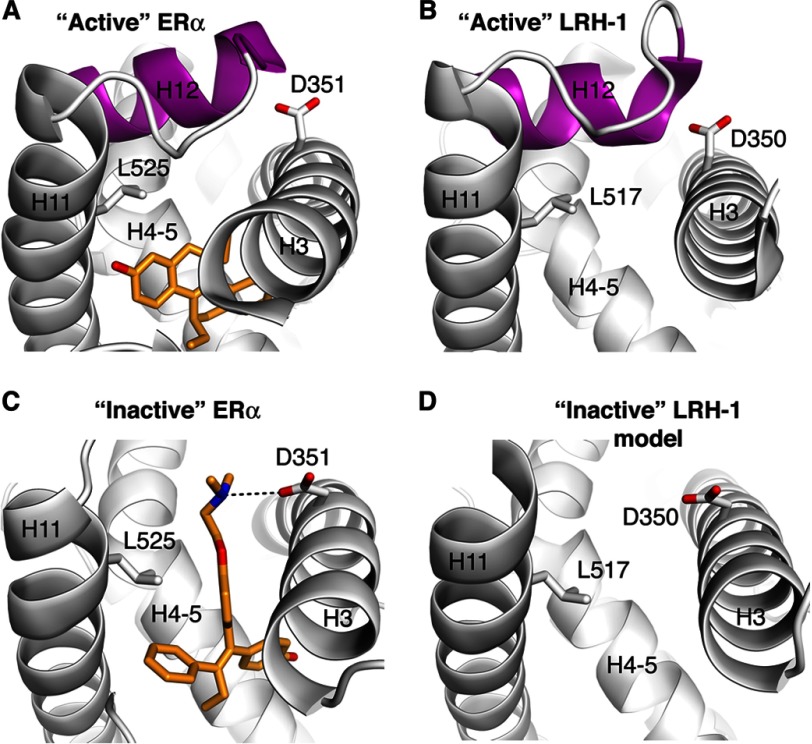
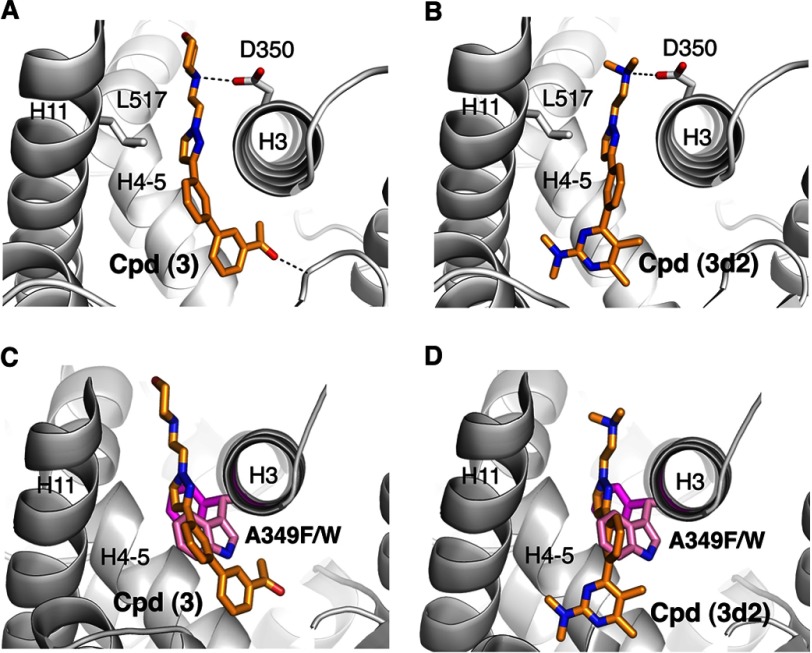
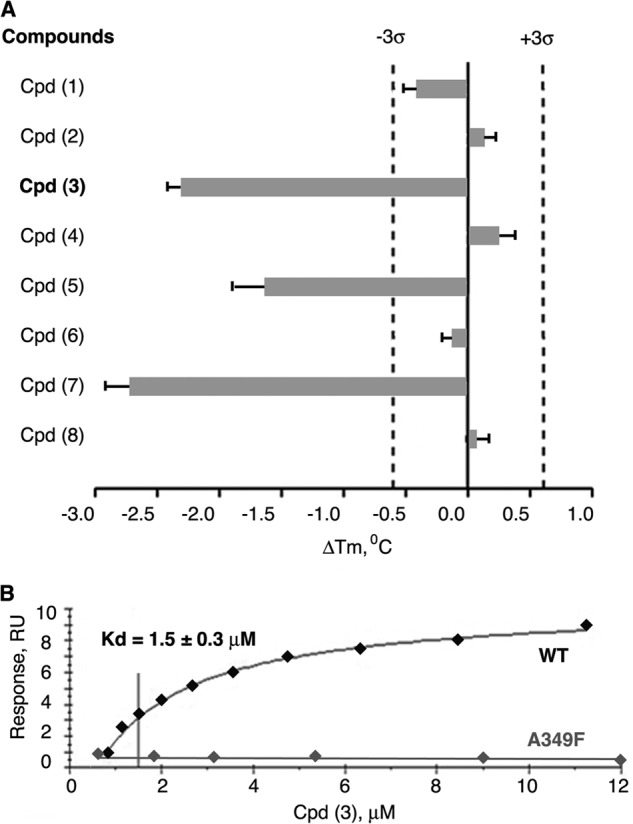
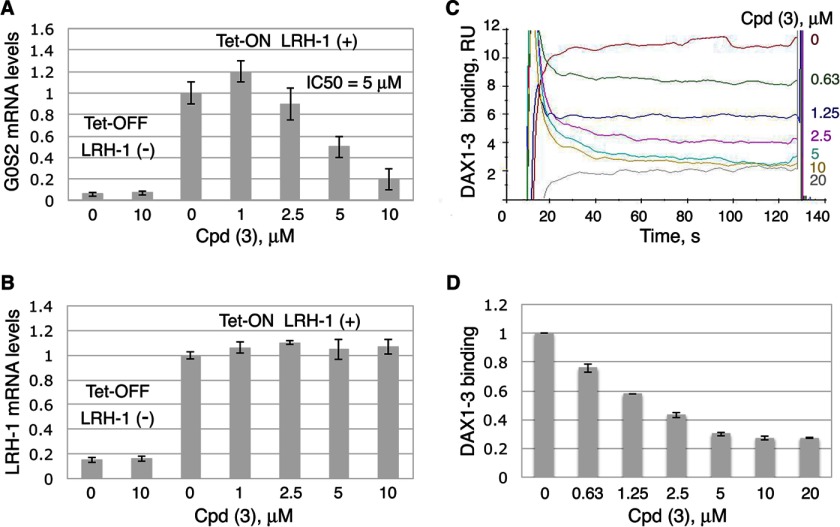
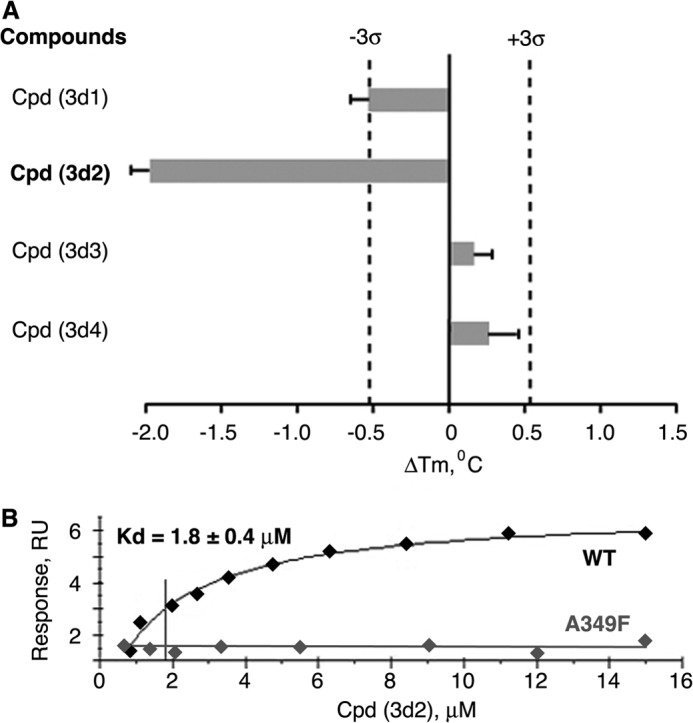
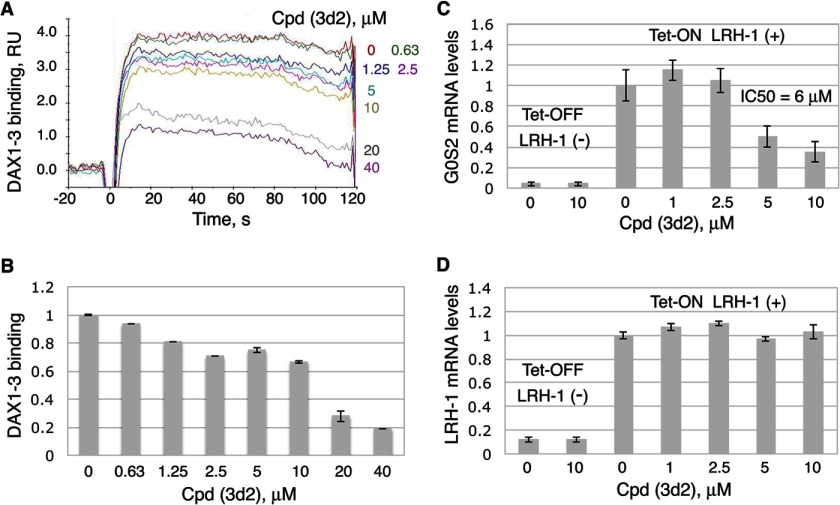
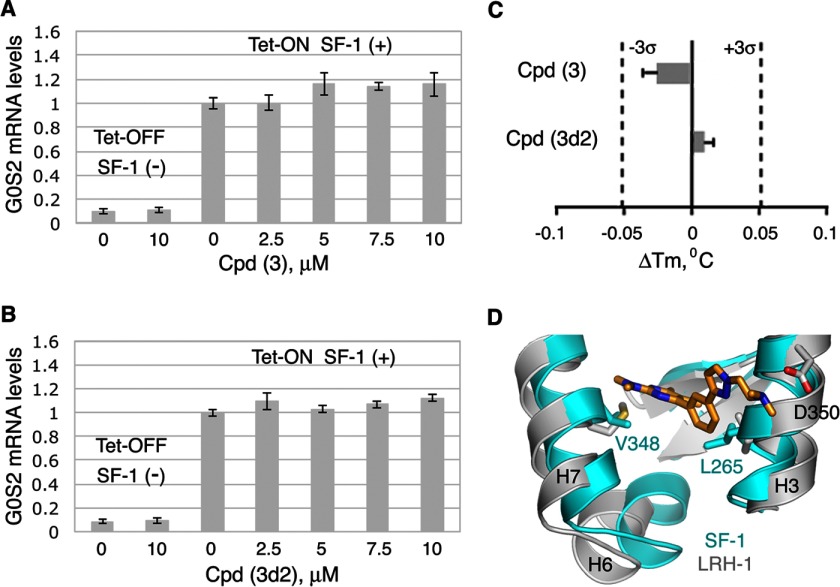
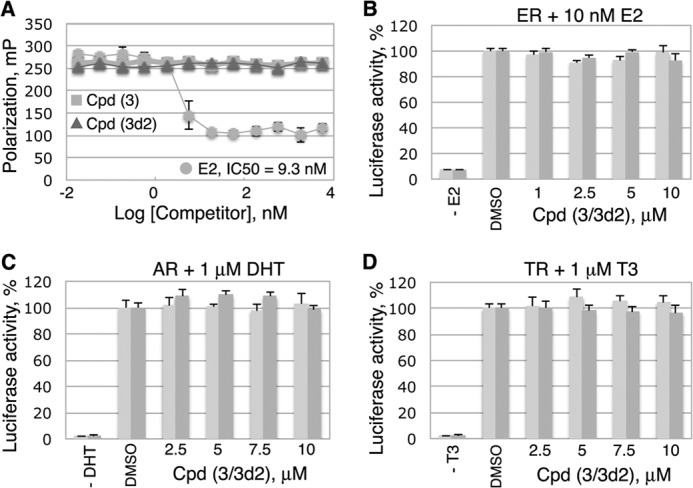
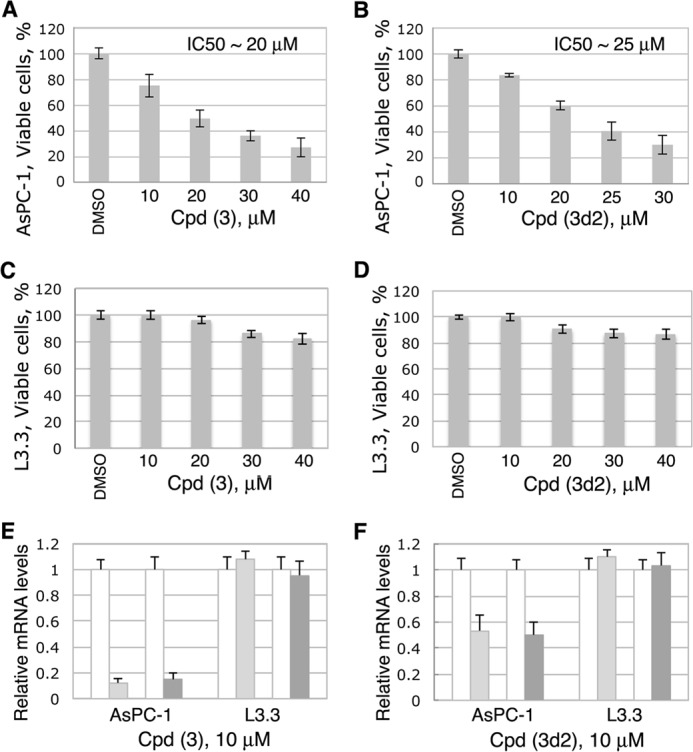
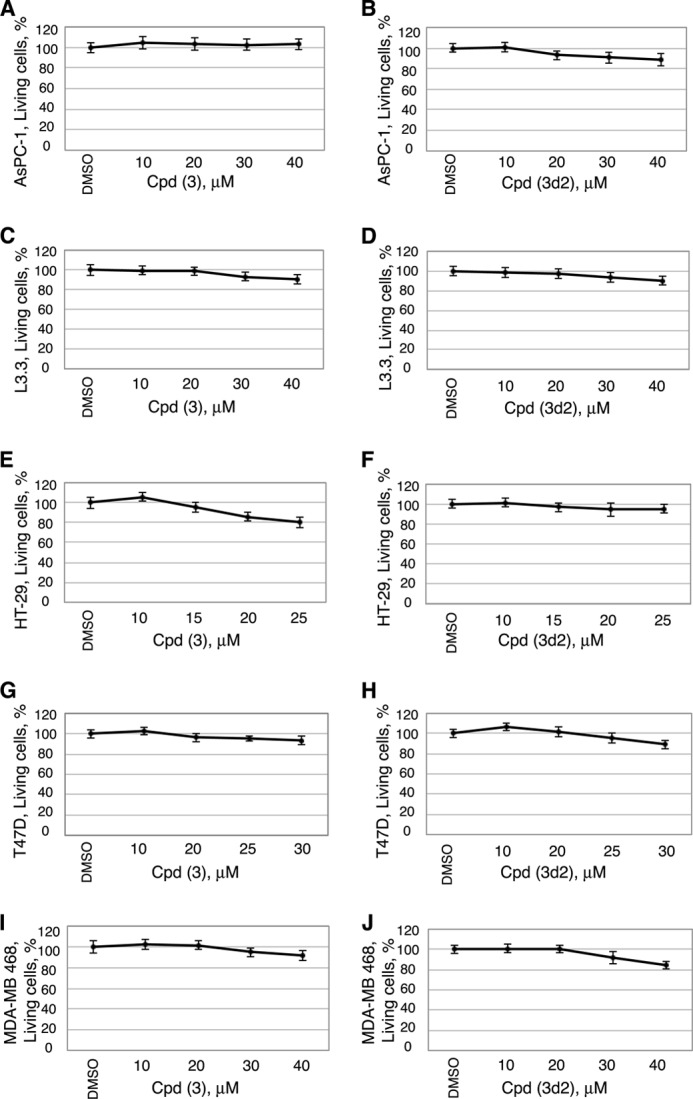
Liver receptor homolog 1 (nuclear receptor LRH-1, NR5A2) is an essential regulator of gene transcription, critical for maintenance of cell pluripotency in early development and imperative for the proper functions of the liver, pancreas, and intestines during the adult life. Although physiological hormones of LRH-1 have not yet been identified, crystallographic and biochemical studies demonstrated that LRH-1 could bind regulatory ligands and suggested phosphatidylinositols as potential hormone candidates for this receptor. No synthetic antagonists of LRH-1 are known to date. Here, we identify the first small molecule antagonists of LRH-1 activity. Our search for LRH-1 modulators was empowered by screening of 5.2 million commercially available compounds via molecular docking followed by verification of the top-ranked molecules using in vitro direct binding and transcriptional assays. Experimental evaluation of the predicted ligands identified two compounds that inhibit the transcriptional activity of LRH-1 and diminish the expression of the receptor's target genes. Among the affected transcriptional targets are co-repressor SHP (small heterodimer partner) as well as cyclin E1 (CCNE1) and G0S2 genes that are known to regulate cell growth and proliferation. Treatments of human pancreatic (AsPC-1), colon (HT29), and breast adenocarcinoma cells T47D and MDA-MB-468 with the LRH-1 antagonists resulted in the receptor-mediated inhibition of cancer cell proliferation. Our data suggest that specific antagonists of LRH-1 could be used as specific molecular probes for elucidating the roles of the receptor in different types of malignancies.

Keywords: Antagonist; Hormone Receptors; Inhibitor; LRH-1; Ligand-binding Protein; Molecular Docking; NR5A2; Nuclear Receptors; Transcription Regulation.


Figures

FIGURE 1.
FIGURE 1.
Design of a model for LRH-1 ligand-binding pocket in an antagonized state. A, architecture of the pocket of ERα with bound agonist. A schematic model for ERα polypeptide chain (ERα LBD bound by R,R-5,11-cis-diethyl-5,6,11,12-tetrahydrochrysene-2,8-diol, PDB code 1L2I) is shown in gray; structural elements forming the pocket (H3, H4–H5, H11, and H12) are indicated; helix H12 docked in the “active” conformation is highlighted in magenta. Bound agonist is shown as a stick model. B, architecture of the hormone-binding pocket of LRH-1 in transcriptionally active state. A schematic model for LRH-1 polypeptide chain (PDB code 1YUC) is shown in gray, with structural elements forming the pocket indicated. Helix H12 docked in the active conformation is highlighted in magenta. C, architecture of the hormone-binding pocket of ERα with antagonist 4-hydroxytamoxifen bound in the pocket. Structural elements forming the ligand-binding pocket of ERα (PDB code 3ERT) are indicated. Bound antagonist is shown as a stick model. An alternative conformation for side chain of Asp-351 facilitating binding interactions of ERα with 4-hydroxytamoxifen is indicated. D, model for the hormone-binding pocket of LRH-1 in transcriptionally inactive state. Undocked helix H12 is omitted from the model. Alternative conformations for side chains of Leu-517 and Asp-350 predicted to facilitate binding interactions of LRH-1 with potential ligands-antagonists are indicated.
FIGURE 2.
FIGURE 2.
Predicted mode of binding for the identified LRH-1 antagonists. A and B, schematic model for LRH-1 polypeptide chain in the vicinity of the hormone-binding pocket is shown in gray, with structural elements forming the pocket indicated. Docked receptor antagonists (compound 3 in A and compound 3d2 in B) are shown as color-coded stick models. Side chains of Leu-517 and Asp-350 predicted to facilitate binding interactions of LRH-1 with ligands-antagonists are indicated. C and D, mutations in the LRH-1 ligand-binding pocket (A349F and A349W, shown in magenta and pink) predicted to interfere with binding of compounds 3 and 3d2 to the receptor (shown in C and D, respectively); these mutants were used as negative controls in in vitro direct binding assays.
FIGURE 3.
FIGURE 3.
Results of direct binding assays for eight selected LRH-1 ligands with predicted antagonistic properties. A, melting temperature shifts for LRH-1 LBD treated with candidate compounds. Three out of eight receptor antagonist candidates (compounds 3, 5, and 7) shift the melting temperature (Tm) of hLRH-1 LBD, demonstrating direct binding to the receptor. For each tested compound, averaged data are shown as horizontal bars; experimental errors and 3σ thresholds are indicated with solid and dashed lines. Compound 3 demonstrating antagonistic effect in transcription assay is indicated in boldface. B, evaluation of binding affinity of compound 3 in Biacore-based assay. The purified LRH-1 protein (either wild type or mutant variants A349F/W) was covalently immobilized to the surface of a CM5 chip, solutions of compound 3 at 0.8–15 μm concentrations were injected over immobilized LRH-1 and reference surfaces, and dose-dependent steady-state responses were recorded and measured relative to the reference. The equilibrium dissociation constant (Kd, indicated for wild type LRH-1 LBD) was determined using steady-state analysis of binding affinities, assuming 1:1 ligand-protein stoichiometry. No dose-dependent binding was observed for LRH-1 ligand pocket mutant A349F under similar conditions (negative control, indicated).
FIGURE 4.
FIGURE 4.
Inhibition of transcriptional activity of LRH-1 by compound 3. A and B, compound 3 inhibits transcriptional activity of LRH-1. HEK293 cells harboring Tet-inducible expression vector encoding full-length LRH-1 were treated with either DMSO (0.1%, solvent control) or compound 3 at different concentrations (indicated). The experiments were performed both in the presence and the absence of Tet (indicated as Tet-On LRH-1(+) and Tet-Off LRH-1(−) in A and B). Following 24-h treatments, levels of mRNA for G0S2 (LRH-1 target gene, shown in A) and mRNA for LRH-1 (shown in B) in all cell samples were evaluated by qPCR. For each concentration point, data are shown relative to control (0.1% DMSO), as average of three independent measurements, with experimental errors shown as black lines. The corresponding IC50 value was calculated using Prism 5 software and is indicated in A. C and D, compound 3 diminishes binding of DAX1–3 peptide to LRH-1 in Biacore-based assay. The purified LRH-1 LBD protein was covalently immobilized to the surface of a CM5 chip, and solutions of DAX1–3 peptide at 100 nm concentration were injected over immobilized LRH-1 and reference surfaces in the presence of either 5% DMSO (solvent control) or different concentrations (0.063–40 μm) of Cpd 3. Dose-dependent steady-state responses were recorded and measured relative to the reference (shown in C). Quantification of the Biacore data is shown in D; gray bars indicate binding of DAX1–3 peptide in the presence of different concentrations of Cpd 3 relative to control; experimental errors are shown as black lines. RU, response units.
FIGURE 5.
FIGURE 5.
Results of direct binding assays for selected analogs of compound 3. A, melting temperature shifts for LRH-1 LBD treated with analog compounds. One out of four selected compound analogs (compound 3d2) shifts the melting temperature (Tm) of hLRH-1 LBD, demonstrating direct binding to the receptor. For each tested compound, averaged data are shown as horizontal bars; experimental errors and 3σ thresholds are indicated with solid and dashed lines. Analog 3d2 demonstrating antagonistic effect in transcription assay is indicated in boldface. B, assessment of binding affinity of analog 3d2 in Biacore-based analysis. The purified LRH-1 protein (either wild type or mutant variants A349F/W) was covalently immobilized to the surface of a CM5 chip; solutions of compound 3d2 at 0.8–15 μm concentrations were injected over immobilized LRH-1 and reference surfaces, and dose-dependent steady-state responses were recorded and measured relative to the reference. The equilibrium dissociation constant (Kd, indicated for wild type LRH-1 LBD) was determined using steady-state analysis of binding affinities, assuming 1:1 ligand-protein stoichiometry. Under similar conditions, no binding was observed for LRH-1 ligand pocket mutant A349F (negative control, indicated).
FIGURE 6.
FIGURE 6.
Inhibition of transcriptional activity of LRH-1 by compound 3d2. A and B, compound 3d2 diminishes binding of DAX1–3 peptide to LRH-1 in Biacore-based assay. The purified LRH-1 LBD protein was covalently immobilized to the surface of a CM5 chip, and solutions of DAX1–3 peptide at 100 nm concentration were injected over immobilized LRH-1 and reference surfaces in the presence of either 5% DMSO (solvent control) or different concentrations (0.063–40 μm) of Cpd 3d2. Dose-dependent steady-state responses were recorded and measured relative to the reference (shown in A). Quantification of the Biacore data is shown in B; gray bars indicate binding of DAX1–3 peptide in the presence of different concentrations of Cpd 3d2 relative to control; experimental errors are shown as black lines. C and D, compound 3d2 inhibits transcriptional activity of LRH-1. HEK293 cells harboring Tet-inducible expression vector encoding full-length LRH-1 were treated with either DMSO (0.1%, solvent control) or compound 3d2 at different concentrations (indicated). The experiments were performed both in the presence and the absence of Tet (indicated as Tet-On LRH-1(+) and Tet-Off LRH-1(−) in C and D). Following 24-h treatments, levels of mRNA for G0S2 (shown in C) and LRH-1 (shown in D) in all samples were evaluated by qPCR. For each concentration point, data are shown relative to control (0.1% DMSO), as average of three independent measurements, with experimental errors shown as black lines. The corresponding IC50 value was calculated using Prism 5 software and is indicated in C. RU, response unit.
FIGURE 7.
FIGURE 7.
Assessing specificity of compounds 3 and 3d2. Neither compound 3 (A) nor its analog 3d2 (B) affect transcriptional activity of hSF-1. HEK293 cells harboring Tet-inducible expression vector encoding full-length SF-1 were treated with either DMSO (0.1%, solvent control) or individual compounds at indicated concentrations (shown in A for Cpd 3 and in B for Cpd 3d2). The experiments were performed both in the presence and the absence of Tet (indicated as Tet-On SF-1(+) and Tet-Off SF-1(−) in A and B). Following 24-h treatments, levels of mRNA for G0S2 gene in all cell samples were evaluated by qPCR. For each concentration point, data are shown relative to control (0.1% DMSO), as average of three independent measurements, with experimental errors shown as black lines. C, melting temperature shifts for hSF-1 LBD treated with compounds 3 and 3d2. Neither compound demonstrates any significant effect on the melting temperature of the receptor. For each tested compound, averaged data are shown as horizontal bars; experimental errors and 3σ thresholds are indicated with solid and dashed lines. D, differences between hLRH-1 and hSF-1 LBPs. Selected structural elements forming the two receptors LBPs are superposed and shown in blue for SF-1 and in gray for LRH-1. Different amino acid residues in the vicinity of a docked ligand (shown for Cpd 3d2 as predicted by modeling) are indicated.
FIGURE 8.
FIGURE 8.
Assessing specificity of compounds 3 and 3d2. Neither compound 3 nor its analog 3d2 inhibits transcriptional activities of ERα, AR, or TRβ receptors. A, compounds 3 and 3d2 do not bind to ERα LBD in a competitive fluorescence polarization ligand binding assay. The assay was performed in a black multiwell plate using the PolarscreenTM ERα competitor assay (Invitrogen) with FluormoneTM E2-ERα complex, in the presence of either E2 (positive control) or individual compounds at different concentrations (indicated). Error bars indicate standard deviations from the mean values of triplicate measurements. B, transactivation assays with ERα in the absence or the presence of 10 nm E2 demonstrated no detectable changes in the transcriptional activity of the receptor following treatments with either Cpd 3 or Cpd 3d2 (see “Experimental Procedures” for details). C and D, analogous transactivation assays with AR and TRβ receptors (shown in C and D, see “Experimental Procedures” for details) were performed in the absence or the presence of either 1 μm dihydrotestosterone (indicated for AR in C) or 1 μm T3 (shown for TRβ in D). No detectable compound-mediated effects were observed in these experiments. B–D, light and dark gray bars represent data for Cpd 3 and Cpd 3d2, respectively. All measurements were done in triplicates; the corresponding data are shown as average, with experimental errors indicated.
FIGURE 9.
FIGURE 9.
LRH-1 antagonists inhibit proliferation of pancreatic cancer cells AsPC-1 (LRH-1-positive) but not L3.3 cells (LRH-1-negative). A–D, cell proliferation rates for both pancreatic cancer cells were measured and compared in the absence and the presence of different concentrations of compounds 3 (A and C) and 3d2 (B and D) relative to control (0.1% DMSO). The corresponding IC50 values are indicated. Evaluations of general cytotoxic effects for both compounds in these cells were performed in parallel and are shown in Fig. 10. E and F, effects of compounds 3 (E) and 3d2 (F) on transcription of the receptor target genes NR0B2 (encoding SHP) and CCNE1 (encoding cyclin E1, CycE1) in AsPC-1 and L3.3 cells. Cell samples were analyzed by qPCR for the relative levels of mRNA corresponding to SHP and Cyc E1 following treatments with individual compounds at 10 μm concentration. Controls in white correspond to cells treated with solvent (0.1% DMSO); light and dark gray bars show the levels of mRNA for SHP and Cyc E1 in cells treated with indicated compounds. Data are shown as average of three independent measurements, with experimental errors indicated.
FIGURE 10.
FIGURE 10.
Cytotoxicity data for human cancer cells treated with compounds 3 and 3d2. Shown are data for pancreatic cancer cells AsPC-1 (A and B) and L3.3 (C and D), colon cancer cells HT-29 (E and F), and breast cancer cells T47D (G and H) and MDA-MB 468 (I and J). Viability measurements for cells treated with different concentrations of compounds are shown relative to control (0.1% DMSO). For each cell line, cytotoxicity was assessed 24 h following the addition of compounds, using the CytoTox-Glo cytotoxicity assay reagent (Promega). All data are shown as average of three independent measurements, and experimental errors are indicated as black lines (mean ± S.D.).
FIGURE 11.
FIGURE 11.
LRH-1 antagonists inhibit proliferation of LRH-1-positive colon and breast cancer cells in a dose-dependent manner. Cell proliferation rates for colon (A and B) as well as ER-positive (C and D) and ER-negative (E and F) breast cancer cells were measured and compared in the absence and the presence of different concentrations of compounds 3 and 3d2 relative to control (0.1% DMSO). For each cell line, concentrations of compounds associated with ∼50% inhibition of cell proliferation are indicated. Evaluations of general cytotoxic effects for both compounds in these cells were performed in parallel and are shown in Fig. 10.

References

    1. Fayard E., Auwerx J., Schoonjans K. (2004) LRH-1: an orphan nuclear receptor involved in development, metabolism, and steroidogenesis. Trends Cell Biol. 14, 250–260 - PubMed
    1. Fayard E., Schoonjans K., Annicotte J.-S., Auwerx J. (2003) Liver receptor homolog 1 controls the expression of carboxyl ester lipase. J. Biol. Chem. 278, 35725–35731 - PubMed
    1. Kim J. W., Peng N., Rainey W. E., Carr B. R., Attia G. R. (2004) Liver receptor homolog-1 regulates the expression of steroidogenic acute regulatory protein in human granulosa cells. J. Clin. Endocrinol. Metab. 89, 3042–3047 - PubMed
    1. Clyne C. D., Kovacic A., Speed C. J., Zhou J., Pezzi V., Simpson E. R. (2004) Regulation of aromatase expression by the nuclear receptor LRH-1 in adipose tissue. Mol. Cell. Endocrinol. 215, 39–44 - PubMed
    1. Gu P., Goodwin B., Chung A. C., Xu X., Wheeler D. A., Price R. R., Galardi C., Peng L., Latour A. M., Koller B. H., Gossen J., Kliewer S. A., Cooney A. J. (2005) Orphan nuclear receptor LRH-1 is required to maintain Oct4 expression at the epiblast stage of embryonic development. Mol. Cell. Biol. 25, 3492–3505 - PMC - PubMed

Publication types

MeSH terms