. 2013;11(5):e1001558.
doi: 10.1371/journal.pbio.1001558. Epub 2013 May 7.

Multiplexing stimulus information through rate and temporal codes in primate somatosensory cortex

Affiliations

Multiplexing stimulus information through rate and temporal codes in primate somatosensory cortex

Michael A Harvey et al. PLoS Biol. 2013.

Abstract

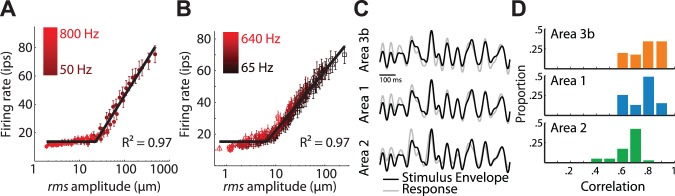
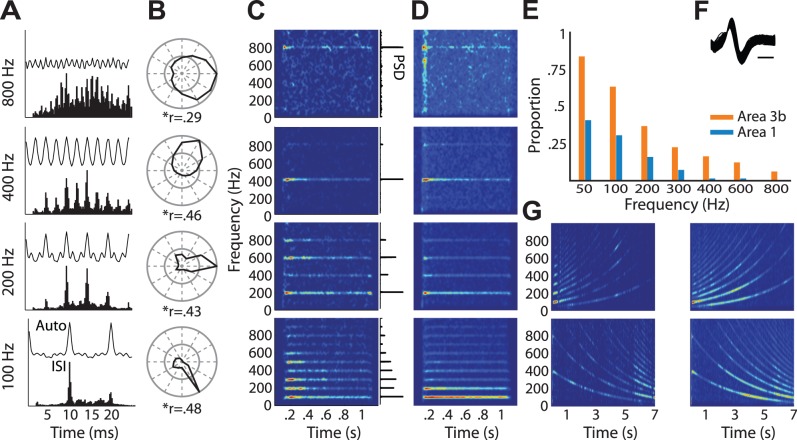
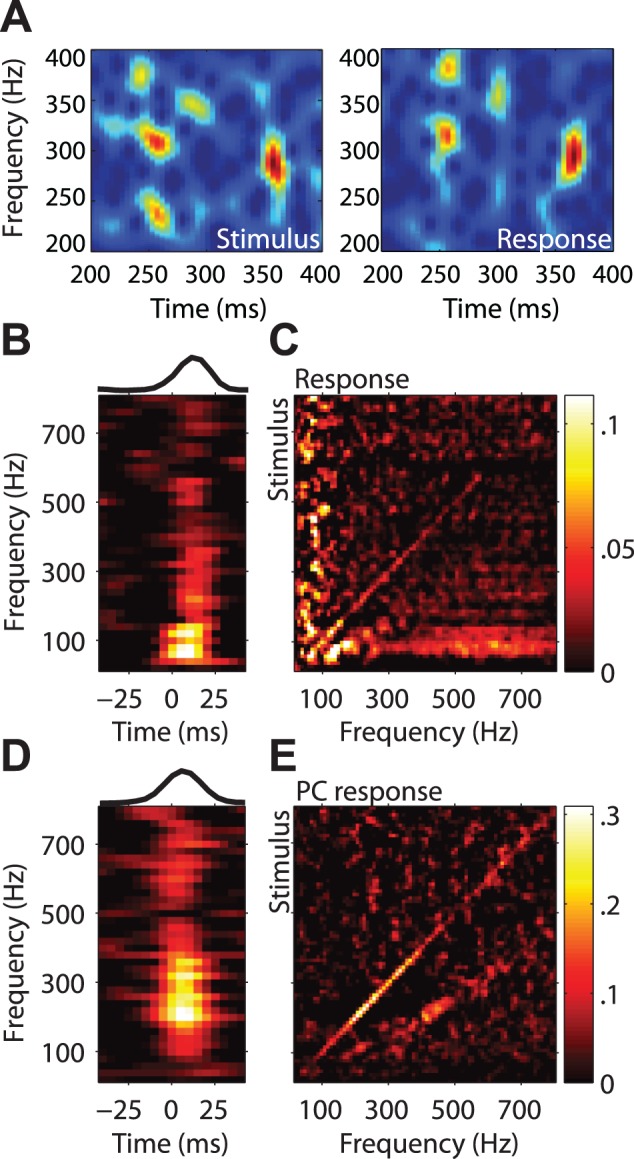
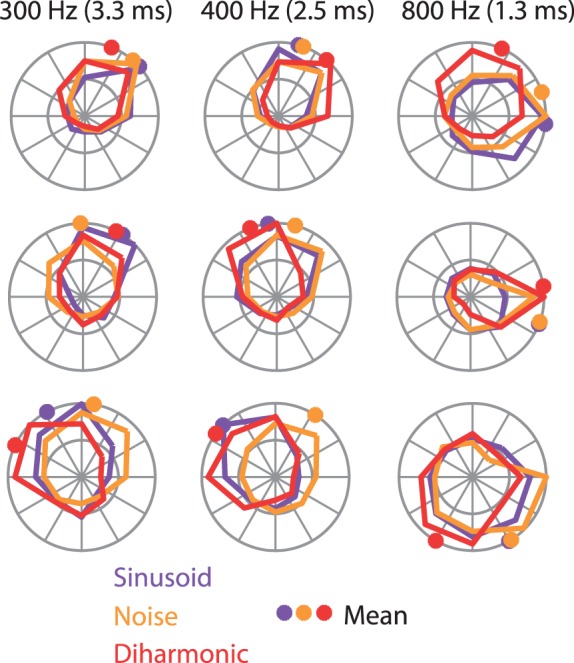
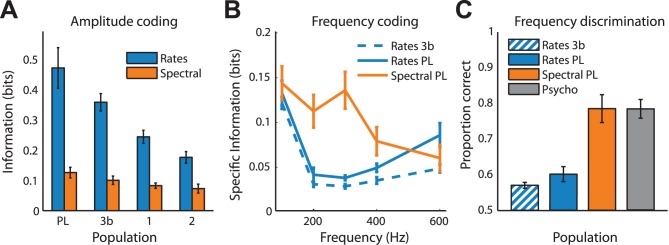
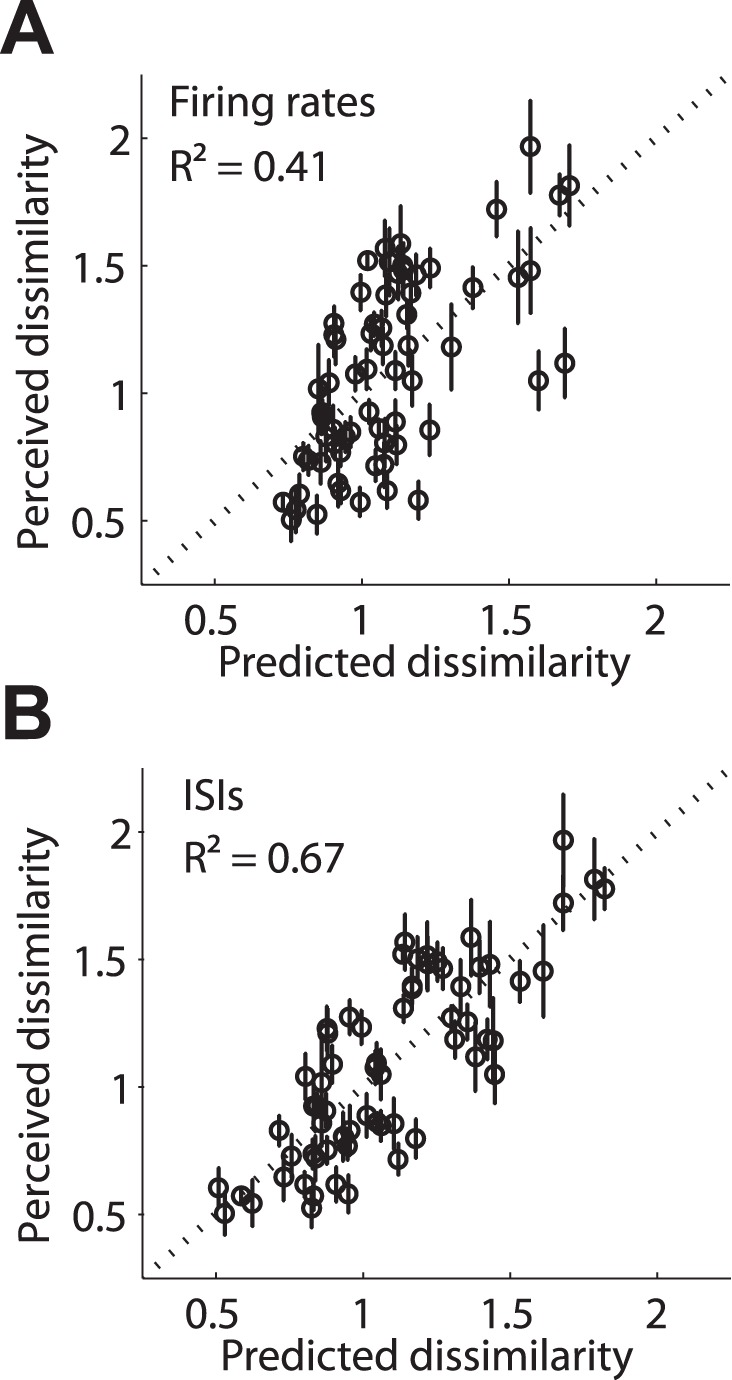
Our ability to perceive and discriminate textures relies on the transduction and processing of complex, high-frequency vibrations elicited in the fingertip as it is scanned across a surface. How naturalistic vibrations, and by extension texture, are encoded in the responses of neurons in primary somatosensory cortex (S1) is unknown. Combining single unit recordings in awake macaques and perceptual judgments obtained from human subjects, we show that vibratory amplitude is encoded in the strength of the response evoked in S1 neurons. In contrast, the frequency composition of the vibrations, up to 800 Hz, is not encoded in neuronal firing rates, but rather in the phase-locked responses of a subpopulation of neurons. Moreover, analysis of perceptual judgments suggests that spike timing not only conveys stimulus information but also shapes tactile perception. We conclude that information about the amplitude and frequency of natural vibrations is multiplexed at different time scales in S1, and encoded in the rate and temporal patterning of the response, respectively.


Conflict of interest statement

The authors have declared that no competing interests exist.

Figures

Figure 1
Figure 1. Stimulus amplitude versus firing rates.
(A) Mean rate-intensity function for neurons in area 3b, computed from responses to sinusoids; marker colors change from dark to bright red with increasing stimulation frequency; error bars denote standard error of the mean. The shallow and frequency-independent increase in firing rate at low amplitudes is due to progressive neuronal recruitment and is not observed in the responses of individual neurons (see Figure S1A). (B) Rate-intensity function for neurons in area 3b, computed from responses to band-pass noise stimuli; colors change from dark to bright red as the center frequency of the noise increases; markers denote different noise conditions (triangle, noiseA; circle, noiseV; square, noiseP, see Materials and Methods). For both individual neurons and neural populations, responses are independent of the frequency composition of the stimulus. (C) Hilbert transform of a sample noise stimulus (black) and smoothed time-varying population firing rates (gray) in areas 3b (top), 1 (middle), and 2 (bottom). The neural response is time-shifted to account for neural delays. (D) Mean correlation between the time-varying population response and the logarithm of the stimulus envelope in the three areas.
Figure 2
Figure 2. Temporal patterning in cortical responses to sinusoidal stimulation.
(A) Autocorrelations (top) and interspike interval histograms (bottom) for one neuron in area 3b, whose responses are entrained with the stimulus up to 800 Hz. (B) Phase histograms along with vector strength (r) for the same neuron as in (A) showing action potentials tended to occur during a restricted phase of each stimulus cycle. (C) Spectrograms for the same neuron as in (A), with corresponding power spectral densities (PSD) in the insets to the right. Note that the temporal patterning begins almost immediately and lasts for the duration of the stimulus, and that the fundamental frequency in the neural response reflects the frequency of the sinusoid. (D) Average spectrograms computed from the population of neurons that exhibited significantly phase-locked responses above 200 Hz (11 neurons in area 3b, five neurons in area 1). (E) Proportion of neurons in areas 3b and 1 that produced phase-locked responses at each frequency tested. (F) Traces of 1,000 action potential waveforms for the neuron whose responses are shown in (A–C); scale bar = 250 µs. (G) Spectrograms of neural responses to sine-sweep stimuli with either upward or downward sweeps between 50 and 400 Hz (left, same neuron as in (A); right, average over phase-locked population).
Figure 3
Figure 3. Cross-correlation of the spectral content of the stimulus with the spectral content of the response.
(A) Spectrogram of one band-pass noise stimulus (left) and corresponding spectrogram of a single neuron response (right). (B) Average cross-correlation of stimulus and response spectrograms for the population of PL neurons, showing correlations between stimulus frequency and responses at the same frequency for different lags. Top inset: cross-correlation averaged across frequencies (peak lag at ∼18 ms) (C) Cross-correlations as in (B), but showing stimulus versus response frequency at the optimal lag. (D,E) Same as in (B,C) but for a population of PC afferents (peak lag at ∼5 ms).
Figure 4
Figure 4. Phase tuning for complex stimuli.
Normalized histograms showing phase tuning for sinusoidal (purple), diharmonic (red), and band-pass noise stimuli (orange) at three different frequencies (indicated at the top, along with the corresponding cycle duration) for three example neurons (rows). Colored dots indicate preferred phase. The phase tuning is highly consistent across stimulus types.
Figure 5
Figure 5. Multiplexing of stimulus information.
(A) Mean mutual information between stimulus amplitude and firing rates (blue) and between stimulus amplitude and spectral peak (orange), computed from the responses of PL neurons, and neurons in areas 3b, 1, and 2. (B) Mean specific information about stimulus frequency conveyed in the response rates and timing of S1 neurons. (C) Performance on a frequency discrimination task (300 Hz versus 200 or 400 Hz) predicted from the firing rates of individual neurons in area 3b, from the rates of individual PL neurons (blue), and from the spectral peak of the responses of PL neurons (orange). Performance of human subjects is shown in grey. Error bars denote the standard error of the mean on all panels.
Figure 6
Figure 6. Predicting psychophysical responses to noise stimuli.
Predicted versus perceived dissimilarity as calculated from (A) firing rates, and (B) ISIs. Each dot represents the mean perceived dissimilarity of one pair of stimuli. Predictions based on ISI distributions are significantly better than those based on firing rates alone, suggesting that spike timing contributes to perception. Error bars denote standard error of the mean.

References

    1. Hollins M, Risner SR (2000) Evidence for the duplex theory of tactile texture perception. Percept Psychophys 62: 695–705. - PubMed
    1. Bensmaia SJ, Hollins M (2003) The vibrations of texture. Somatosens Mot Res 20: 33–43. - PMC - PubMed
    1. Bensmaia S, Hollins M (2005) Pacinian representations of fine surface texture. Percept Psychophys 67: 842–854. - PubMed
    1. Weber AI, Cheng JW, Dammann JF, Bensmaia SJ (2011) The coding of natural textures at the somatosensory periphery. In: 41st Annual Meeting of the Society for Neuroscience, Washington (D.C.), Abstract 750.01.
    1. Muniak MA, Ray S, Hsiao SS, Dammann JF, Bensmaia SJ (2007) The neural coding of stimulus intensity: linking the population response of mechanoreceptive afferents with psychophysical behavior. J Neurosci 27: 11687–11699. - PMC - PubMed

Publication types