. 2013 May 1;5(1):198-219.
doi: 10.1007/s12561-012-9068-3.

eQTL Mapping Using RNA-seq Data

Affiliations

eQTL Mapping Using RNA-seq Data

Wei Sun et al. Stat Biosci. .

Abstract

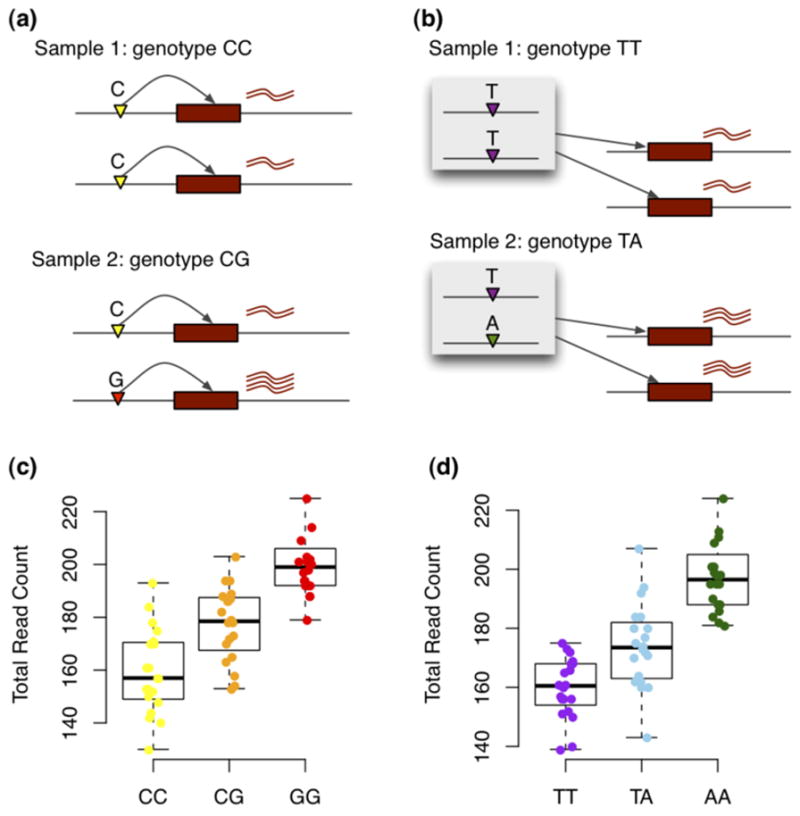
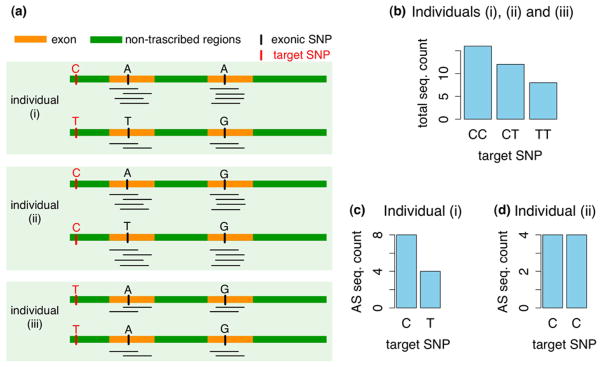
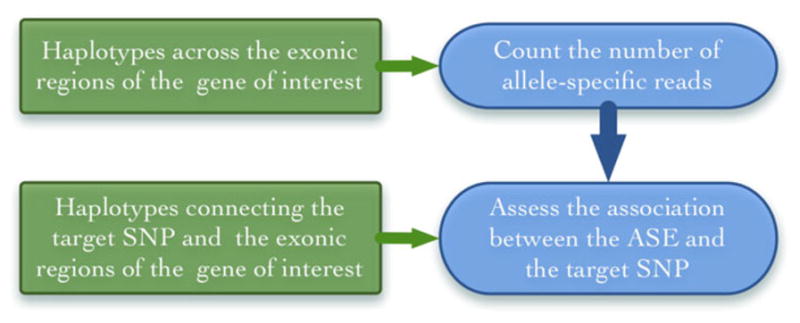
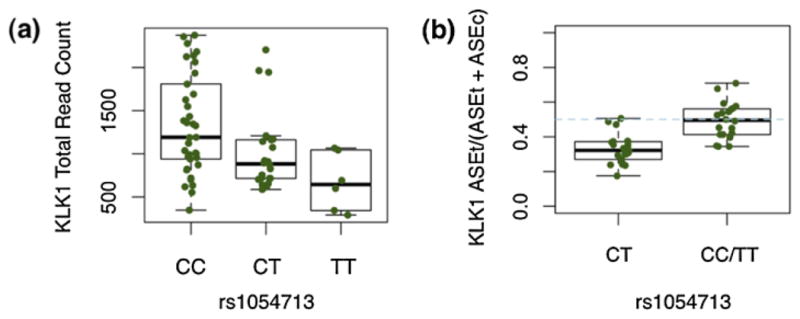
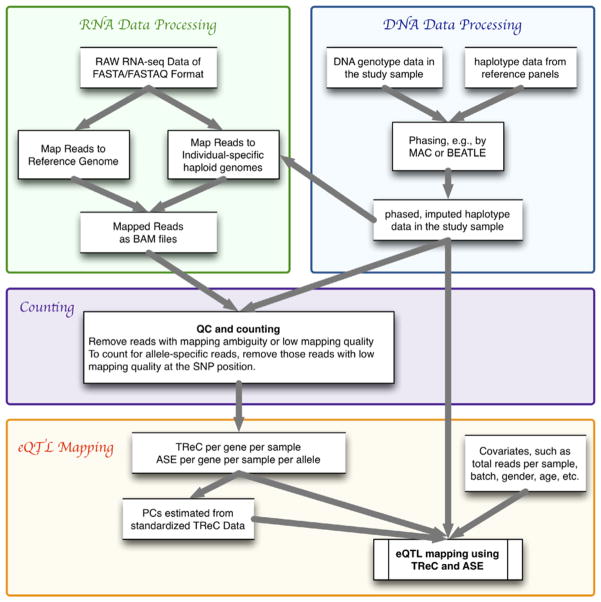
As RNA-seq is replacing gene expression microarrays to assess genome-wide transcription abundance, gene expression Quantitative Trait Locus (eQTL) studies using RNA-seq have emerged. RNA-seq delivers two novel features that are important for eQTL studies. First, it provides information on allele-specific expression (ASE), which is not available from gene expression microarrays. Second, it generates unprecedentedly rich data to study RNA-isoform expression. In this paper, we review current methods for eQTL mapping using ASE and discuss some future directions. We also review existing works that use RNA-seq data to study RNA-isoform expression and we discuss the gaps between these works and isoform-specific eQTL mapping.

Keywords: Allele-specific gene expression (ASE); Gene expression quantitative trait locus (eQTL); RNA isoform; RNA-seq.


Figures

Fig. 1
Fig. 1
(a) An example of a cis-eQTL in two samples. In Sample 2 where the target SNP (the SNP for which we test association) has a heterozygous genotype CG, the expressions of the two alleles are different. (b) An example of a trans-eQTL in two samples. In Sample 2 where the target SNP has a heterozygous genotype TA, the expressions of the two alleles are the same. (c) A simulated data for a cis-eQTL across 60 samples with 20 samples within each genotype class. (d) A simulated data for a trans-eQTL across 60 samples with 20 samples within each genotype class
Fig. 2
Fig. 2
(a) RNA-seq measurements of a gene with two exons in three individuals. (b) TReC for the three individuals. (c) ASE for individual (i). (d) ASE for individual (ii)
Fig. 3
Fig. 3
A flow chart of the two-step procedure for eQTL mapping using ASE
Fig. 4
Fig. 4
(a) An example of TReC association between the gene KLK1 and SNP rs1054713. The y-axis is the total number of reads mapped to the gene KLK1 and each point corresponds to one of the 65 samples. (b) An example of ASE association. The y-axis is the proportion of ASEt over all the allele-specific reads. The allele of ASEt is defined as the allele corresponding to the T allele of SNP rs1054713 when the SNP is heterozygous, and it is defined arbitrarily when the SNP is homozygous. When SNP rs1054713 is homozygous, the proportion is around 0.5; when it is heterozygous, the proportion is below 0.5, indicating that the expression from the T allele is lower than that from the C allele
Fig. 5
Fig. 5
A workflow of eQTL mapping using RNA-seq data

References

    1. Ameur A, Wetterbom A, Feuk L, Gyllensten U. Global and unbiased detection of splice junctions from RNA-seq data. Genome Biol. 2010;11(3):R34. - PMC - PubMed
    1. Anders S, Huber W. Differential expression analysis for sequence count data. Genome Biol. 2010;11(10):R106. - PMC - PubMed
    1. Au K, Jiang H, Lin L, Xing Y, Wong W. Detection of splice junctions from paired-end RNA-seq data by SpliceMap. Nucleic Acids Res. 2010;38(14):4570–4578. - PMC - PubMed
    1. Auer P, Doerge R. A two-stage Poisson model for testing RNA-seq data. Stat Appl Genet Mol Biol. 2011;10(1):26.
    1. Birol I, Jackman S, Nielsen C, Qian J, Varhol R, Stazyk G, Morin R, Zhao Y, Hirst M, Schein J, et al. De novo transcriptome assembly with ABySS. Bioinformatics. 2009;25(21):2872. - PubMed

LinkOut - more resources