. 2013 May 7;8(5):e63350.
doi: 10.1371/journal.pone.0063350. Print 2013.

Malaria control and the intensity of Plasmodium falciparum transmission in Namibia 1969-1992

Affiliations

Malaria control and the intensity of Plasmodium falciparum transmission in Namibia 1969-1992

Abdisalan M Noor et al. PLoS One. .

Abstract

Background: Historical evidence of the levels of intervention scale up and its relationships to changing malaria risks provides important contextual information for current ambitions to eliminate malaria in various regions of Africa today.

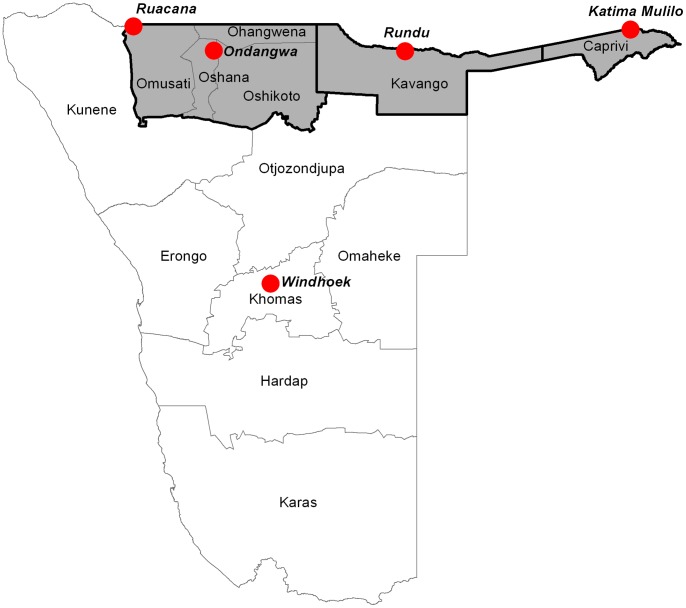
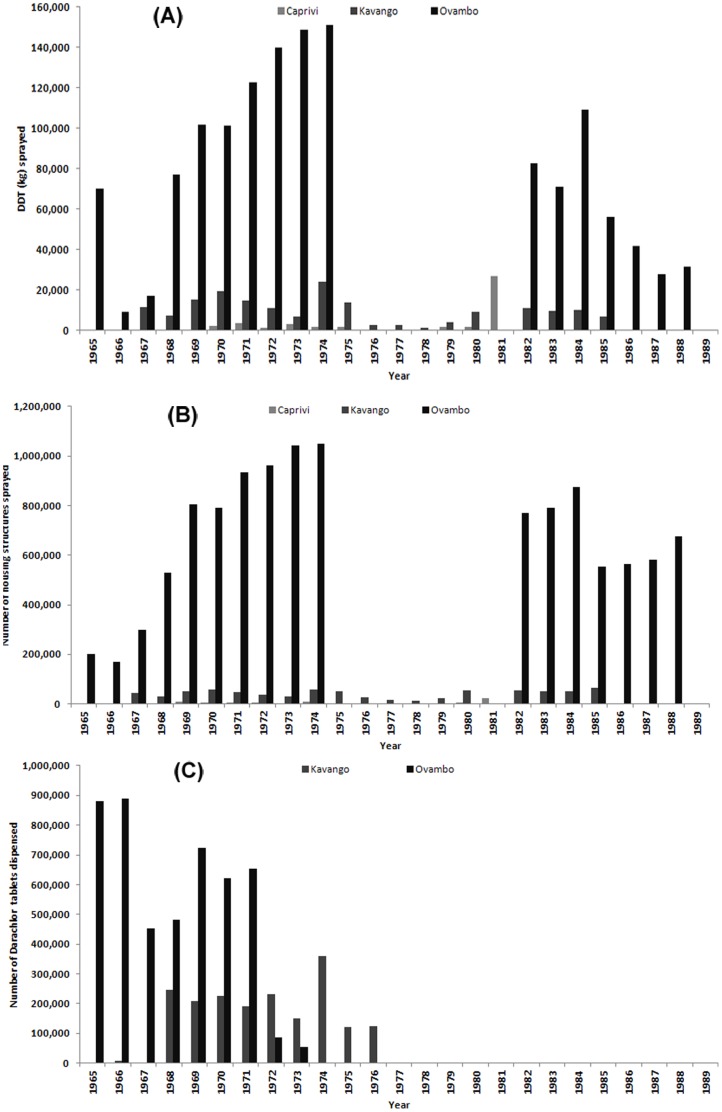
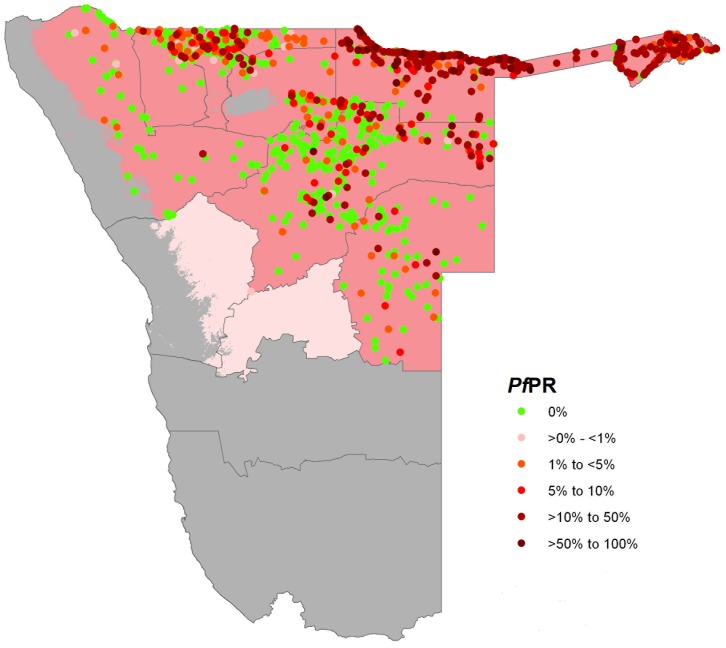
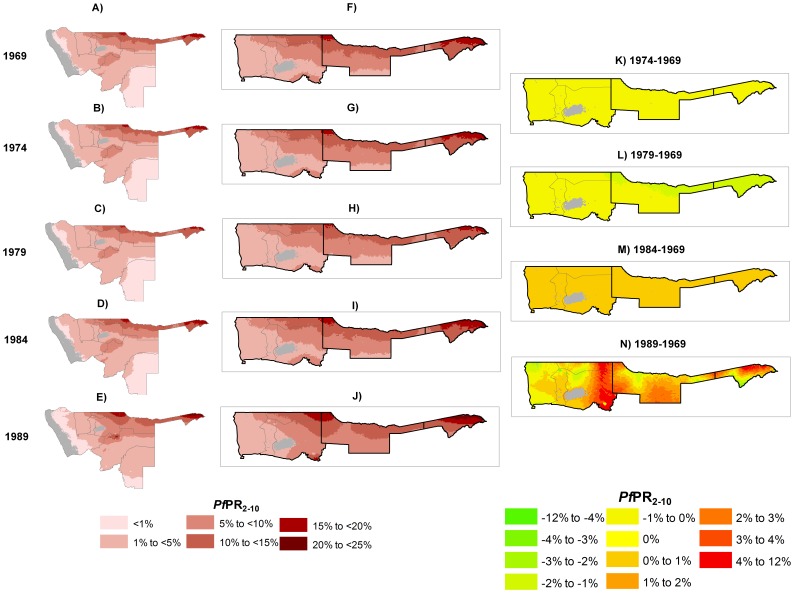
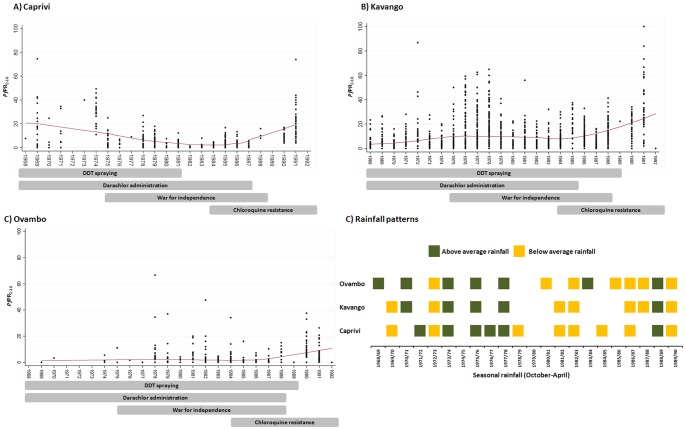
Methods: Community-based Plasmodium falciparum prevalence data from 3,260 geo-coded time-space locations between 1969 and 1992 were assembled from archives covering an examination of 230,174 individuals located in northern Namibia. These data were standardized the age-range 2 to less than 10 years and used within a Bayesian model-based geo-statistical framework to examine the changes of malaria risk in the years 1969, 1974, 1979, 1984 and 1989 at 5×5 km spatial resolution. This changing risk was described against rainfall seasons and the wide-scale use of indoor-residual house-spraying and mass drug administration.

Results: Most areas of Northern Namibia experienced low intensity transmission during a ten-year period of wide-scale control activities between 1969 and 1979. As control efforts waned, flooding occurred, drug resistance emerged and the war for independence intensified the spatial extent of moderate-to-high malaria transmission expanded reaching a peak in the late 1980s.

Conclusions: Targeting vectors and parasite in northern Namibia was likely to have successfully sustained a situation of low intensity transmission, but unraveled quickly to a peak of transmission intensity following a sequence of events by the early 1990s.


Conflict of interest statement

Competing Interests: Abdisalan Mohamed Noor is an academic editor for both PLOS ONE and Guest Editor for PLOS Medicine. The authors confirm that this does not alter the authors' adherence to all the PLOS ONE policies on sharing data and materials and the authors will share their data with interested researchers for academic, non-commercial research, including potentially those from Malaria Atlas Project.

Figures

Figure 1
Figure 1. The boundaries of the 13 first level administrative units (regions) of Namibia and locations of the Capital City, Windhoek, the main towns of the north (Rundu, Katima Mulilo, Ruacana and Ondangwa).
The grey shaded areas with thick black boundary are the intervention areas of Caprivi, Kavango and Ovambo.
Figure 2
Figure 2. Summary intervention distribution and coverage data assembled from monthly and annual reports archived at Tzaneen for Caprivi, Kavango and Ovambo (present-day Omusati, Oshana, Ohangwena and Oshikoto regions) of: A) the amount of DDT (kilograms) used for IRS; B) the number of house structures sprayed; and C) the number of Darachlor tablets dispensed during the period 1965 to 1989 in A) Kavango and B) Ovambo.
Data were unavailable for DDT, housing structures sprayed and Darachor tablets dispensed for the years where data is not shown. Darachlor use was terminated after 1989.
Figure 3
Figure 3. Map of contemporary first level administrative units of Namibia showing the spatial limits of P.falciparum transmission (dark pink) and location of PfPR survey data from the year 1967 to 1992.
Where survey data are available for a location in more than one year, the highest PfPR value is displayed top. Light pink areas support unstable transmission and grey areas are malaria free. Footnote: A temperature suitability index (TSI) for malaria transmission at 1×1 km spatial resolution was used to delineate areas in Namibia where malaria is unlikely to occur, defined as areas where TSI was equal to zero. TSI was constructed using monthly temperature time series within a biological modelling framework to quantify the effect of ambient temperature on sporogony and vector survivorship and determine the suitability of an area to support transmission globally separately for both P. falciparum and P. vivax. Extreme aridity was defined using synoptic mean monthly enhanced vegetation index (EVI) data to classify into areas unlikely to support transmission, defined as areas where EVI was <0.1 in any two consecutive months of the year , . In Namibia TSI and aridity identified the Namib Desert on the Atlantic Coast, parts of the Kalahari Desert in the South and the Etosha and other smaller saltpans as areas that were too hot or dry to support malaria transmission. Finally areas defined as operationally risk free based on reported incidences , , , were identified (southern parts of the regions of Kunene and Omaheke and all of Erongo, Hardap, Khomas and Karas). It is hard to eliminate the possibility of any risks and therefore the parts of Erongo, the whole of Khomas and the southern parts of Omaheke were classified to be of unstable transmission where aridity and temperature do not exclude transmission.
Figure 4
Figure 4. Panel A–D shows the posterior mean distribution of PfPR2–10 by the prediction years of 1969–1989 in Namibia.
Panel F–J shows enlarged maps of the posterior mean distribution of PfPR2–10 by the prediction years of 1969–1989 in the three intervention regions of Caprivi, Kavango and Ovambo. Panel K–N shows the percentage difference from a reference year of 1969 of the PfPR2–10 predictions in 1974, 1979, 1984 and 1989. Negative/positive values indicate a decrease/increase in predicted PfPR2–10. The grey shade represents areas where transmission is unsuitable due to aridity. All maps are at 5×5 km spatial resolution.
Figure 5
Figure 5. Graphs A–C show scatter plots with lowess regression fit of PfPR2–10 by year of survey and the main intervention and political events that may have determined the observed transmission patterns in Caprivi, Kavango and Ovambo respectively.
D) is a summary of the droughts (orange) and above average rainfall (green) as measured using rainfall in the October – April rainfall in Caprivi, Kavango and Ovambo. Seasons not designated as one of drought or above average rainfall are considered to have received average rainfall.

References

    1. The Malaria Elimination 8 Group website. Available: http://www.sadc.int/english/regional-integration/shdsp/sarn/elimination-.... Accessed Apr 10 2012.
    1. Ministry of Health and Social Services (2010). National Vector Borne Diseases Control Programme. Ministry of Health and Social Services. National Malaria Strategic Plan.
    1. Snow RW, Alegana VA, Makomva K, Reich A, Uusiku P, et al... (2010). Estimating the distribution of malaria in Namibia in 2009: assembling the evidence and modeling risk. Ministry of Health & Social Services, Republic of Namibia & Malaria Atlas Project.
    1. Hansford CF (1990). Malaria Control in Namibia. National Institute for Tropical Disease. Tzaneen, South Africa: Department of National Health and Population Development, (unpublished document).
    1. Kamwi RN (2005). Malaria Situation in Namibia. A Study of Vector Species and Effectiveness of the Past and Current Control Strategies in Selected Parts of Namibia [PhD thesis].Namibia: University of Namibia.

Publication types