. 2013 May 7;8(5):e63590.
doi: 10.1371/journal.pone.0063590. Print 2013.

Changes in heart rate variability are associated with expression of short-term and long-term contextual and cued fear memories

Affiliations

Changes in heart rate variability are associated with expression of short-term and long-term contextual and cued fear memories

Jun Liu et al. PLoS One. .

Abstract

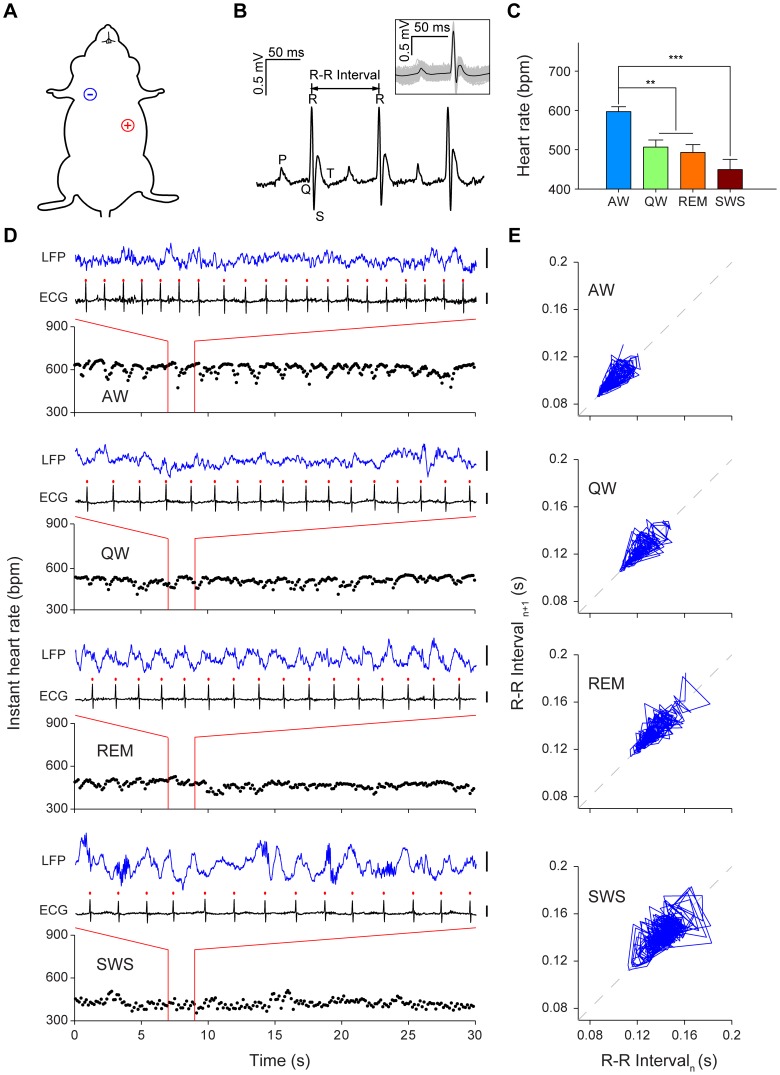
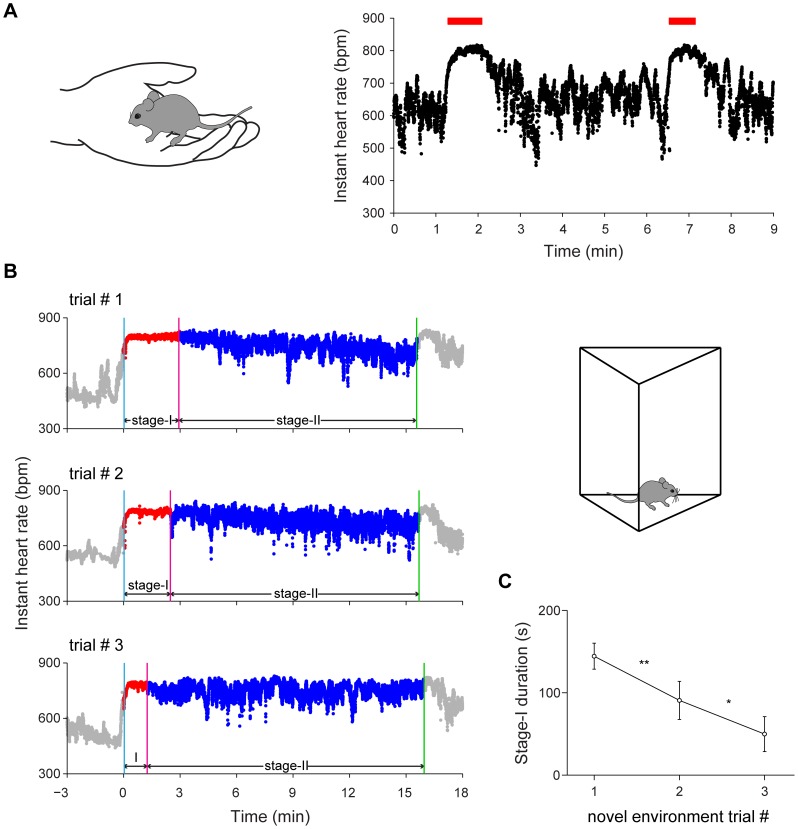
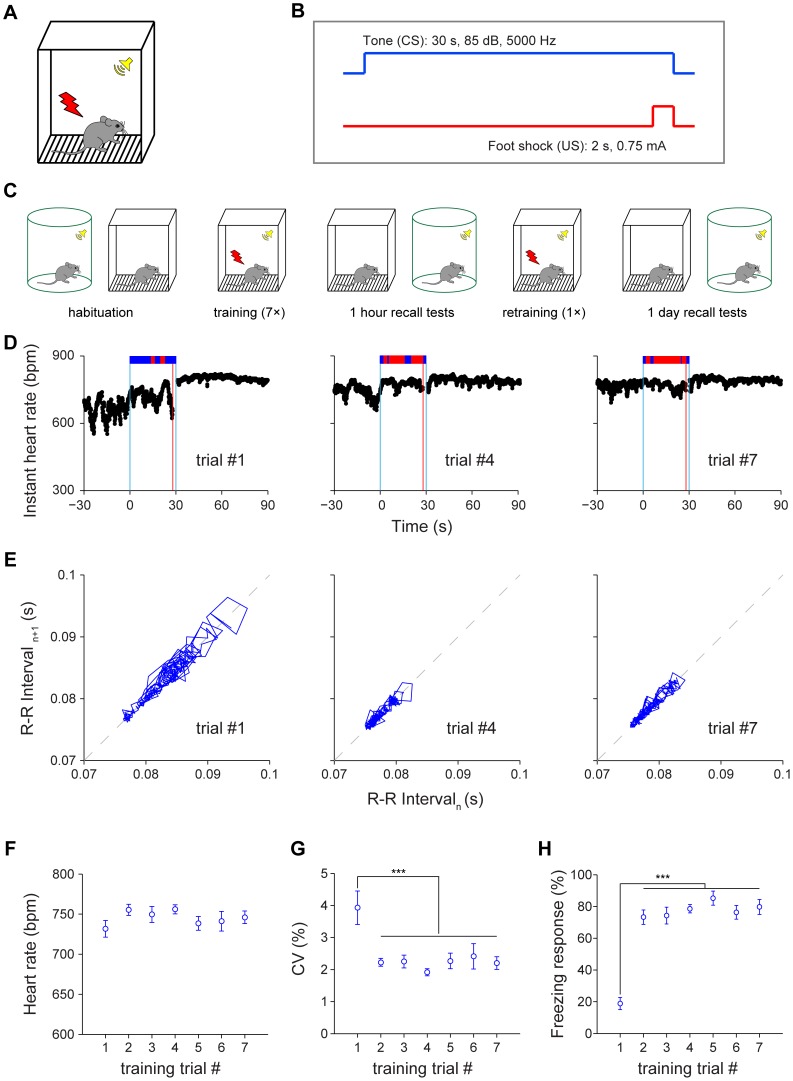
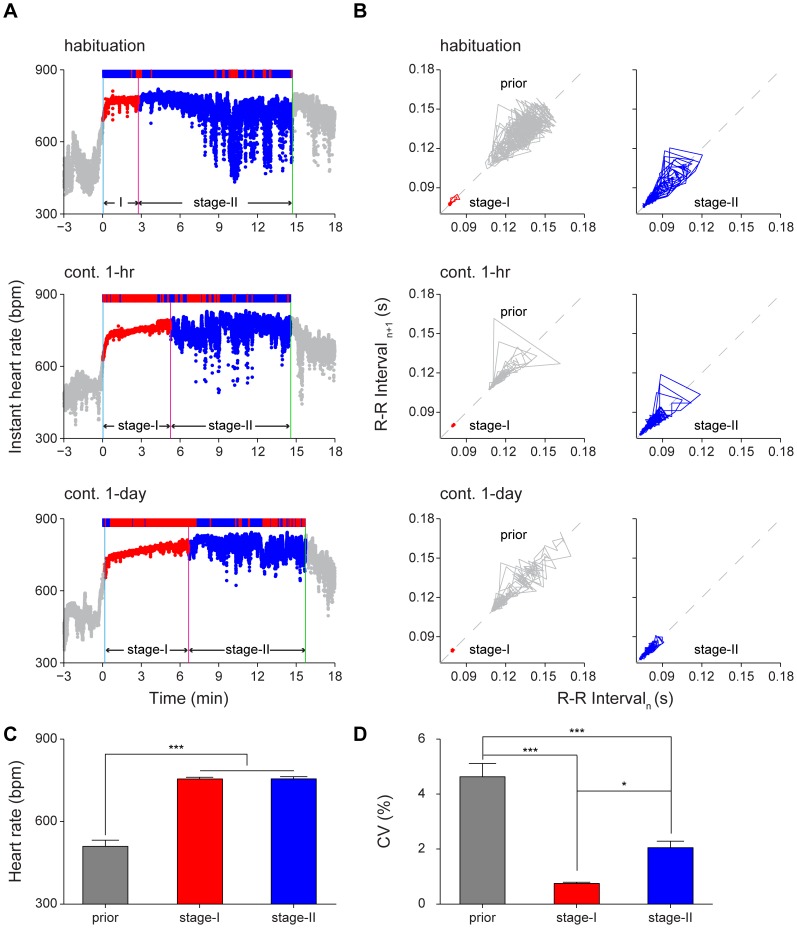
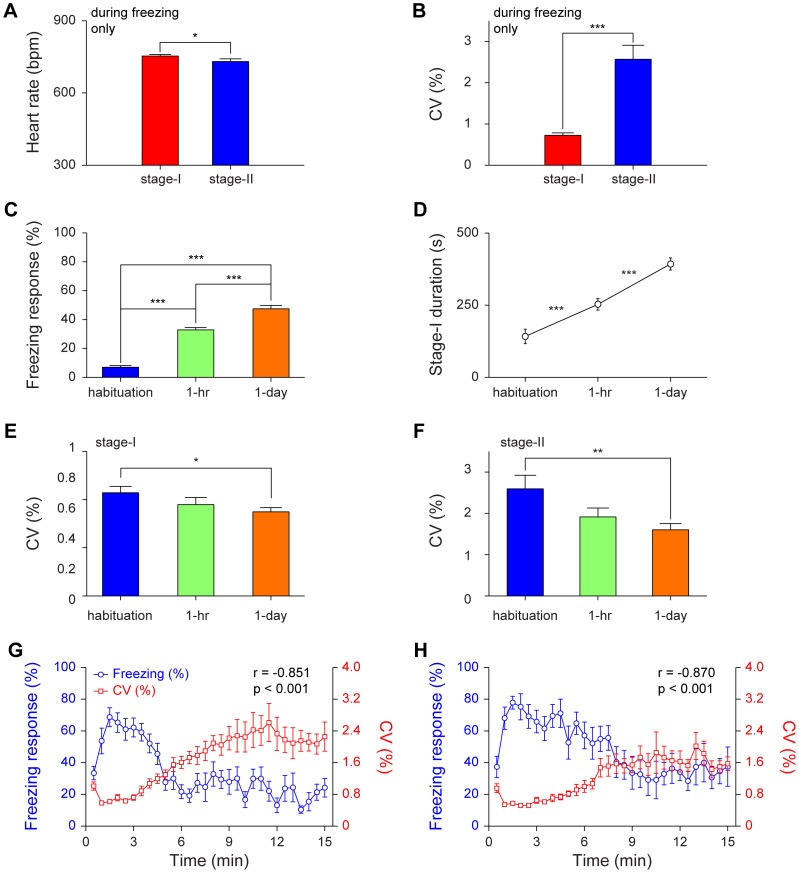
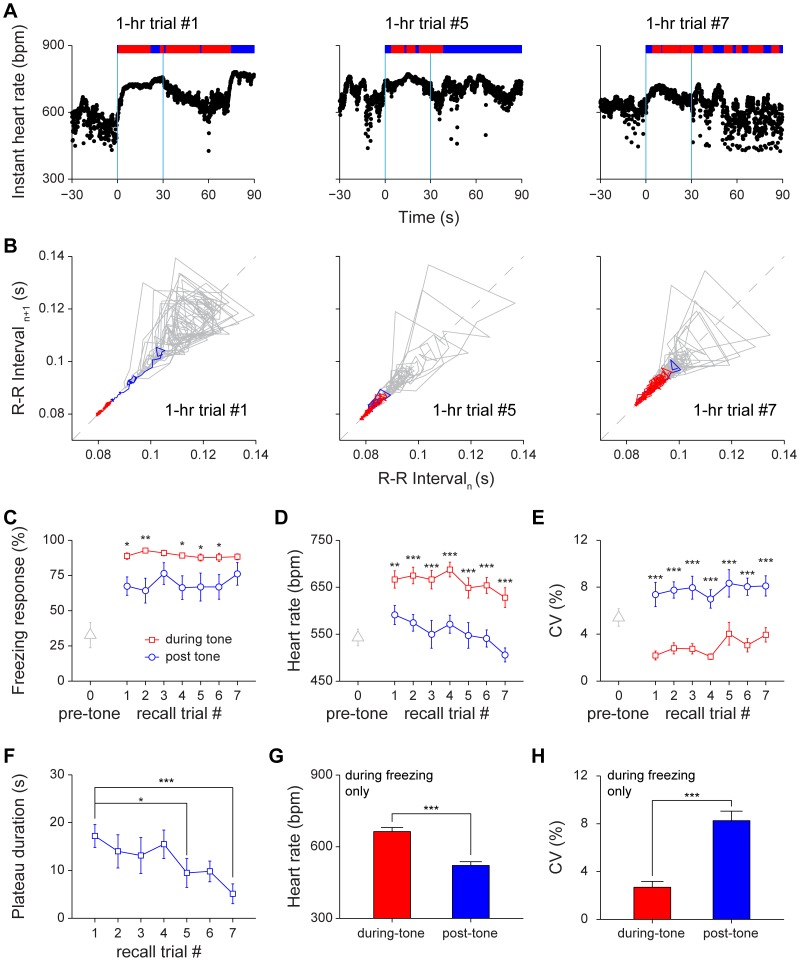
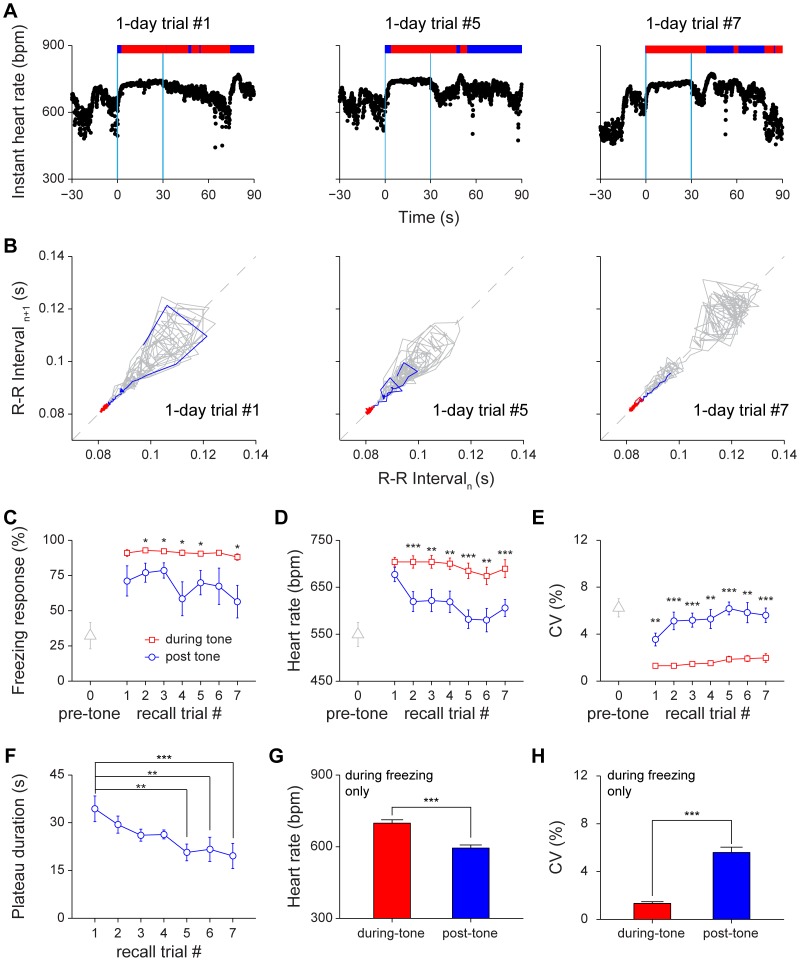
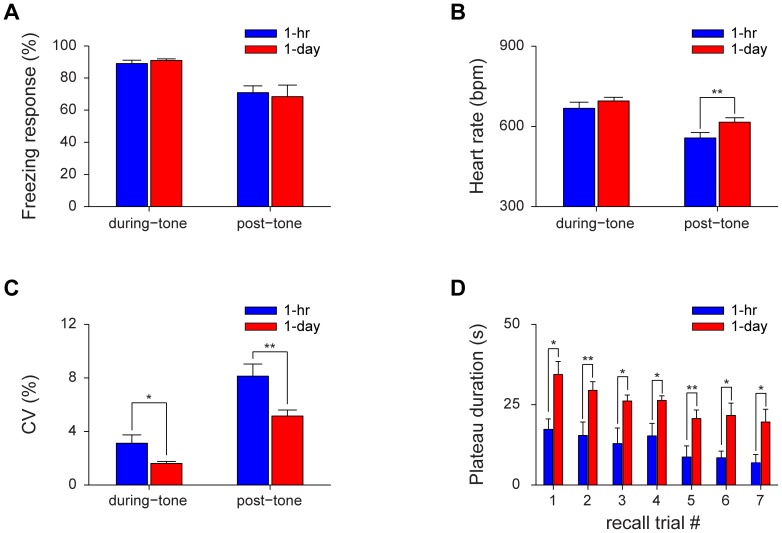
Heart physiology is a highly useful indicator for measuring not only physical states, but also emotional changes in animals. Yet changes of heart rate variability during fear conditioning have not been systematically studied in mice. Here, we investigated changes in heart rate and heart rate variability in both short-term and long-term contextual and cued fear conditioning. We found that while fear conditioning could increase heart rate, the most significant change was the reduction in heart rate variability which could be further divided into two distinct stages: a highly rhythmic phase (stage-I) and a more variable phase (stage-II). We showed that the time duration of the stage-I rhythmic phase were sensitive enough to reflect the transition from short-term to long-term fear memories. Moreover, it could also detect fear extinction effect during the repeated tone recall. These results suggest that heart rate variability is a valuable physiological indicator for sensitively measuring the consolidation and expression of fear memories in mice.


Conflict of interest statement

Competing Interests: The authors have declared that no competing interests exist.

Figures

Figure 1
Figure 1. ECG recording during four behavioral states.
(A) Illustration of the proper ECG electrodes implantation sites on a mouse. The negative electrode (-) was implanted in the mouse’s right upper chest, and the positive electrode (+) was placed in the left abdomen. (B) Three consecutive cycles of heart beats as example of ECG recording. The peaks are labeled by conventional ECG terminology. Inset: average waveform of individual heart beats recorded in 1 minute, centered on the peak of the R-wave. (C) Mean heart rate of mice during four basic behavioral states in the home cage. AW, active wakefulness; QW, quiet wakefulness; REM, rapid eye movement sleep; SWS, slow wave sleep. Error bars, s.e.m.; n = 5; **P<0.01, ***P<0.001, one-way repeated measures ANOVA and Tukey post hoc test. (D) Examples of 30-sec instant HR and 2-sec ECG and hippocampal CA1 LFPs during AW, QW, REM and SWS from an individual mouse. The red dots indicate the peaks of the R-wave. Scales: 0.5 mV. (E) Poincaré plot analysis graphed the same mouse’s R-R interval data of four 1-min periods: during AW, QW, REM and SWS. Successive points in the plots were connected with a line.
Figure 2
Figure 2. Instant heart rate responses to handling and novel environment exposures.
(A) Illustration of the handling method: cup handling (left) and two examples of instant HR response to handling (right). The red bars indicate the duration of handling (49 seconds and 37 seconds, respectively). (B) Instant HR responses of an individual mouse during repeated exposures to a novel environment (left panels) and illustration of a novel environment (right). The blue vertical line indicates the start of stage-I; the red vertical line indicates the end of stage-I; the green vertical line indicates the end of the novel environment exposure. (C) The duration of stage-I during repeated novel environment exposures. Error bars, s.e.m.; n = 7; *P<0.05, **P<0.01, one-way repeated measures ANOVA and Tukey post hoc test.
Figure 3
Figure 3. Effects of fear conditioning on heart rate and heart rate variability.
(A) Illustration of a fear conditioning chamber for producing a tone-shock pairing fear memory. (B) A 30-sec neural tone (85 dB, 5000 Hz) co-terminates with a 2-sec mild foot shock (0.75 mA). (C) Schematic representation of experimental paradigm for cued fear conditioning. (D) Instant HR responses of an individual mouse during three CS-US pairings, trial#1, trial#4 and trial#7. The freezing responses were plotted on top of the instant HR; freezing state, red bar; non-freezing state, blue bar. The blue vertical lines indicate the onset and offset of the tone (30 seconds); the red vertical line indicates the onset of the foot shock (2 seconds). (E) Poincaré plots of the same mouse’s R-R intervals of 28-sec tone duration in trial#1, trial#4 and trial#7. (F) The average HR of 28-sec tone duration during training. (G) The average CV of instant HR of 28-sec tone duration during training. (F) The average freezing responses of 28-sec tone duration during training. Error bars, s.e.m.; n = 11; ***P<0.001, one-way repeated measures ANOVA and Tukey post hoc test.
Figure 4
Figure 4. Increased duration of heart rate variability stage-I in long-term contextual memory retention test.
(A) The instant HR responses of an individual mouse showed clearly two distinct stages: stage-I (red) and stage-II (blue) during the contextual habituation and retention tests. Upper panel: contextual habituation; Middle panel: 1-hr contextual retention test; Lower panel: 1-day contextual retention test. The freezing responses were plotted on top of the instant HR; freezing state, red bar; non-freezing state, blue bar. The blue vertical line indicates the start of stage-I; the red vertical line indicates the end of stage-I; the green vertical line indicates the end of the contextual retention test. (B) Poincaré plots of the same mouse’s R-R intervals of 1-min duration in prior (grey line), stage-I (red line) and stage-II (blue line). The prior was a 3-min period before contextual habituation or retention. Upper panel: contextual habituation; Middle panel: 1-hr contextual retention test; Lower panel: 1-day contextual retention test. (C-D) The HR and CV of prior, stage-I and stage-II during 1-hr contextual retention. Error bars, s.e.m.; n = 11; *P<0.05, ***P<0.001, one-way repeated measures ANOVA and Tukey post hoc test.
Figure 5
Figure 5. Changes in heart rate and heart rate variability in relationships with freezing behavior during contextual recall.
(A–B) The HR and CV of stage-I and stage-II freezing period in 1-hr contextual retention test. n = 11; *P<0.05, ***P<0.001, paired t test. (C) The freezing responses during contextual habituation, contextual 1-hr retention and contextual 1-day retention. n = 8; ***P<0.001, one-way repeated measures ANOVA and Tukey post hoc test. (D) The duration of stage-I during contextual habituation, 1-hr contextual retention and 1-day contextual retention. n = 8; ***P<0.001, one-way repeated measures ANOVA and Tukey post hoc test. (E–F) The CV of stage-I and stage-II during contextual habituation, 1-hr contextual retention and 1-day contextual retention. n = 8; *P<0.05, **P<0.01, one-way repeated measures ANOVA and Tukey post hoc test. (G) The averaged freezing responses in eleven mice were anti-correlated with the averaged CV of instant HR in 1-hr contextual retention (r = –0.851, P<0.001). (H) The averaged freezing responses in eight mice were also anti-correlated with the averaged CV of instant HR in 1-day contextual retention (r = –0.870, P<0.001). All data are plotted as mean ± s.e.m. (error bars).
Figure 6
Figure 6. Changes of heart rate and heart rate variability in 1-hr cued fear retention tests.
(A) Instant HR responses of an individual mouse during three recall trials, trial#1, trial#5 and trial#7. The freezing responses were plotted on top of the instant HR; freezing state, red bar; non-freezing state, blue bar. The blue vertical lines indicate the onset and offset of the tone (30 seconds). (B) Poincaré plots of the same mouse’s R-R intervals of 30-sec pre-tone (grey line) and 30-sec during-tone (blue line and red line) in trial #1, trial #5 and trial #7. The blue line indicates the rising phase of instant HR, which was defined as a period from the onset of tone to the time when HRV reached the stage-I plateau. (C–E) The freezing responses, HR and CV of pre-tone, during-tone and post-tone during 1-hr auditory cued retention. n = 11; *P<0.05, **P<0.01, ***P<0.001, paired t test. (F) The stage-I plateau durations during 1-hr auditory cued retention. n = 11; *P<0.05, ***P<0.001, one-way repeated measures ANOVA and Dunnett’s multiple comparisons test. Dunnett’s multiple comparisons test comparing with recall trial #1 showed that extinction effect reached significant difference at trial #5. (G–H) The HR and CV of the during-tone and post-tone freezing period in 1-hr auditory cued retention test. n = 11; ***P<0.001, paired t test. All data are plotted as mean ± s.e.m. (error bars).
Figure 7
Figure 7. Changes of heart rate and heart rate variability during 1-day cued fear retention tests.
(A) Instant HR responses of the same mouse during three recall trials, trial#1, trial#5 and trial#7. The freezing responses were plotted on top of the instant HR; freezing state, red bar; non-freezing state, blue bar. The blue vertical lines indicate the onset and offset of the tone (30 seconds). (B) Poincaré plots of the same mouse’s R-R intervals of 30-sec pre-tone (grey line) and 30-sec during-tone (blue line and red line) in trial #1, trial #5 and trial #7. The blue line indicates the rising phase of instant HR, which was defined as a period from the onset of tone to the time when HRV reached the stage-I plateau. (C–E) The freezing responses, HR and CV of pre-tone, during-tone and post-tone during 1-day auditory cued retention. n = 8; *P<0.05, **P<0.01, ***P<0.001, paired t test. (F) The stage-I plateau durations during 1-day auditory cued retention. n = 8; **P<0.01, ***P<0.001, one-way repeated measures ANOVA and Dunnett’s multiple comparisons test. Dunnett’s multiple comparisons test comparing with recall trial #1 showed that extinction effect reached significant difference at trial #5. (G–H) The HR and CV of the during-tone and post-tone freezing period in 1-day auditory cued retention test. n = 8; ***P<0.001, paired t test. All data are plotted as mean ± s.e.m. (error bars).
Figure 8
Figure 8. Comparison of heart rates and heart rate variabilities between short-term and long-term cued fear memories.
(A) There was no difference in the total amount of freezing during either 30-sec tone periods or 90-sec post-tone periods between 1-hr and 1-day retention test. (B) The post-tone HR of 1-day auditory cued retention test was significantly higher than that of 1-hr retention test. n = 8; **P<0.01, paired t test. (C) The CV of during-tone and post-tone periods in 1-day auditory cued retention test was greatly reduced compared with 1-hr retention test. n = 8; *P<0.05, **P<0.01, paired t test. (D) The plateau durations during 1-day auditory cued retention were significantly longer than that during 1-hr retention. n = 8; *P<0.05, **P<0.01, paired t test. All data are plotted as mean ± s.e.m. (error bars).

References

    1. Maren S (2001) Neurobiology of Pavlovian fear conditioning. Annu Rev Neurosci 24: 897–931. - PubMed
    1. Kim JJ, Jung MW (2006) Neural circuits and mechanisms involved in Pavlovian fear conditioning: a critical review. Neurosci Biobehav Rev 30: 188–202. - PMC - PubMed
    1. Kim JJ, Fanselow MS (1992) Modality-specific retrograde amnesia of fear. Science 256: 675–677. - PubMed
    1. Thompson RF, Krupa DJ (1994) Organization of memory traces in the mammalian brain. Annu Rev Neurosci 17: 519–549. - PubMed
    1. Thompson RF (2005) In search of memory traces. Annu Rev Psychol 56: 1–23. - PubMed

Publication types

LinkOut - more resources