. 2013 Oct:63:175-86.
doi: 10.1016/j.freeradbiomed.2013.05.009. Epub 2013 May 10.

Cytochrome P450 2E1 potentiates ethanol induction of hypoxia and HIF-1α in vivo

Affiliations

Cytochrome P450 2E1 potentiates ethanol induction of hypoxia and HIF-1α in vivo

Xiaodong Wang et al. Free Radic Biol Med. 2013 Oct.

Abstract

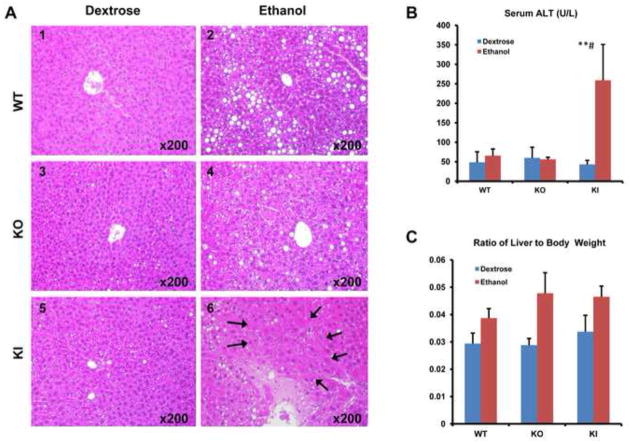
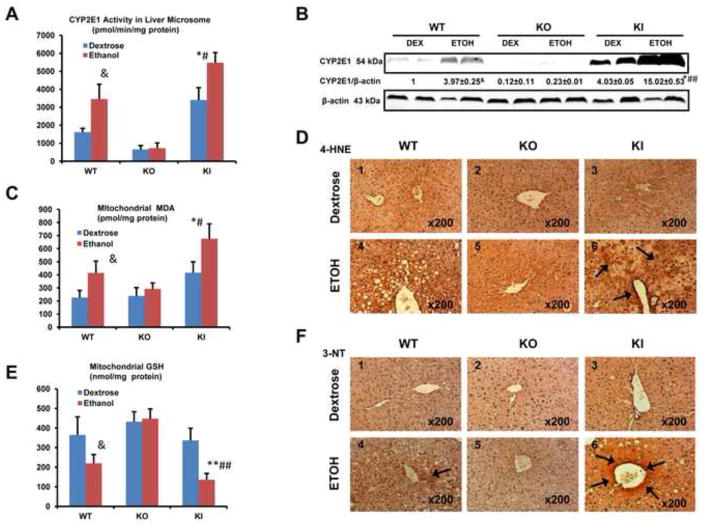
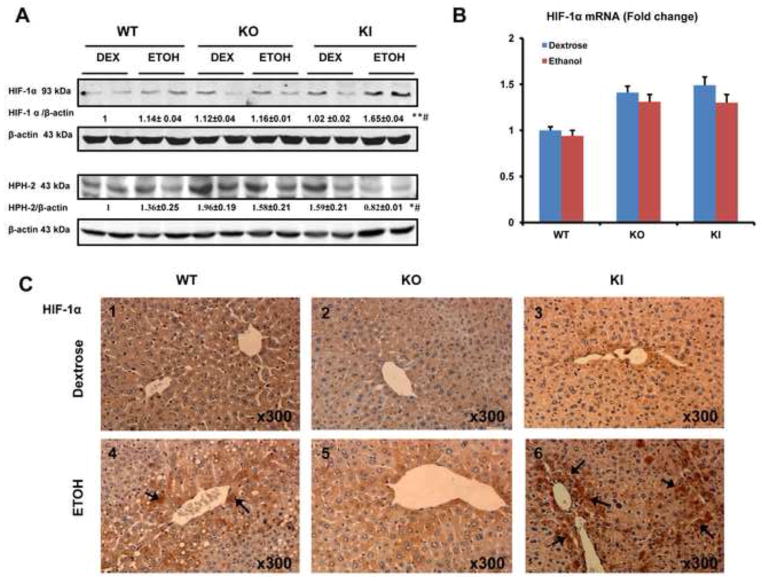
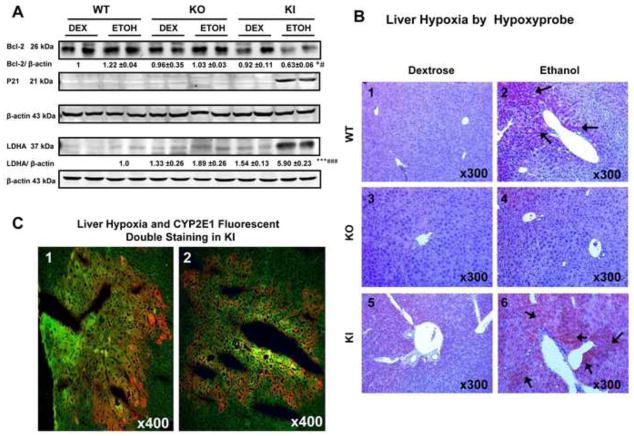
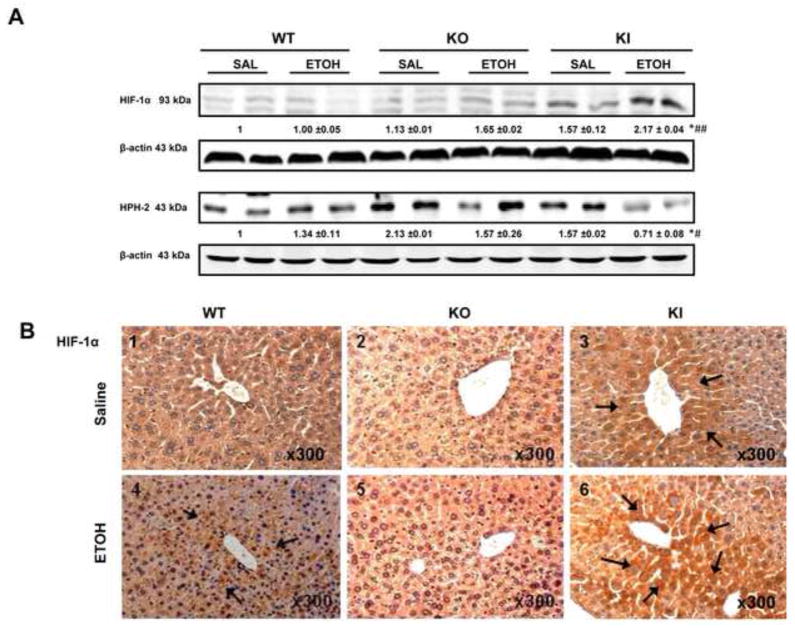
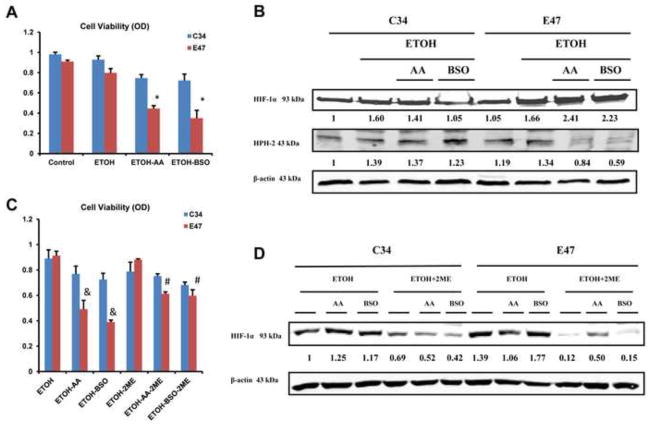
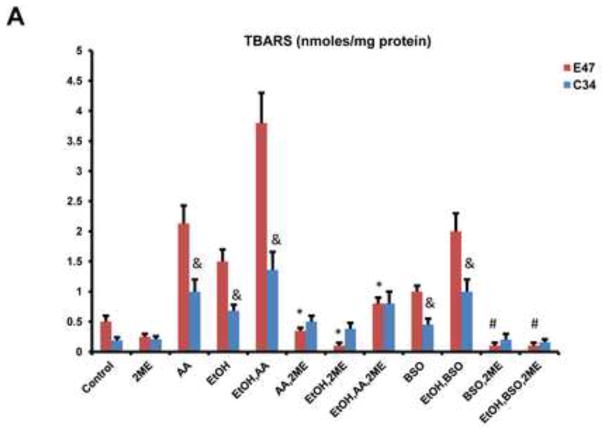
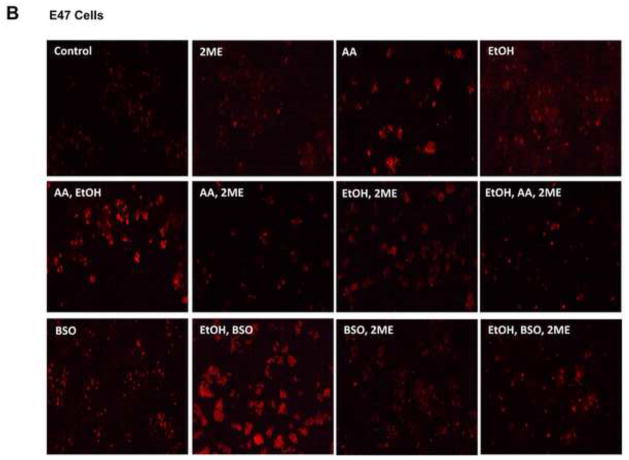
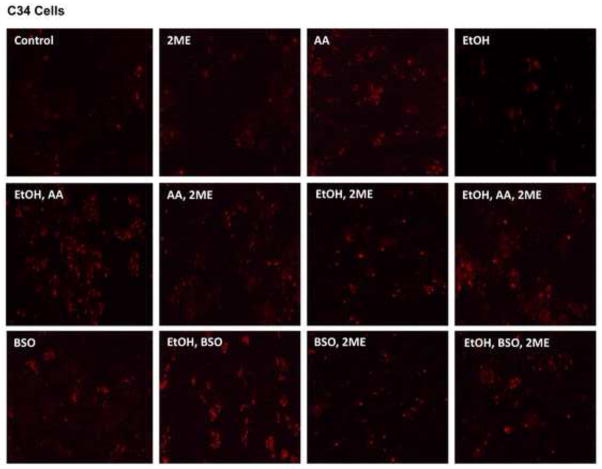
Ethanol induces hypoxia and elevates HIF-1α in the liver. CYP2E1 plays a role in the mechanisms by which ethanol generates oxidative stress, fatty liver, and liver injury. This study evaluated whether CYP2E1 contributes to ethanol-induced hypoxia and activation of HIF-1α in vivo and whether HIF-1α protects against or promotes CYP2E1-dependent toxicity in vitro. Wild-type (WT), CYP2E1-knock-in (KI), and CYP2E1 knockout (KO) mice were fed ethanol chronically; pair-fed controls received isocaloric dextrose. Ethanol produced liver injury in the KI mice to a much greater extent than in the WT and KO mice. Protein levels of HIF-1α and downstream targets of HIF-1α activation were elevated in the ethanol-fed KI mice compared to the WT and KO mice. Levels of HIF prolyl hydroxylase 2, which promotes HIF-1α degradation, were decreased in the ethanol-fed KI mice in association with the increases in HIF-1α. Hypoxia occurred in the ethanol-fed CYP2E1 KI mice as shown by an increased area of staining using the hypoxia-specific marker pimonidazole. Hypoxia was lower in the ethanol-fed WT mice and lowest in the ethanol-fed KO mice and all the dextrose-fed mice. In situ double staining showed that pimonidazole and CYP2E1 were colocalized to the same area of injury in the hepatic centrilobule. Increased protein levels of HIF-1α were also found after acute ethanol treatment of KI mice. Treatment of HepG2 E47 cells, which express CYP2E1, with ethanol plus arachidonic acid (AA) or ethanol plus buthionine sulfoximine (BSO), which depletes glutathione, caused loss of cell viability to a greater extent than in HepG2 C34 cells, which do not express CYP2E1. These treatments elevated protein levels of HIF-1α to a greater extent in E47 cells than in C34 cells. 2-Methoxyestradiol, an inhibitor of HIF-1α, blunted the toxic effects of ethanol plus AA and ethanol plus BSO in the E47 cells in association with inhibition of HIF-1α. The HIF-1α inhibitor also blocked the elevated oxidative stress produced by ethanol/AA or ethanol/BSO in the E47 cells. These results suggest that CYP2E1 plays a role in ethanol-induced hypoxia, oxidative stress, and activation of HIF-1α and that HIF-1α contributes to CYP2E1-dependent ethanol-induced toxicity. Blocking HIF-1α activation and actions may have therapeutic implications for protection against ethanol/CYP2E1-induced oxidative stress, steatosis, and liver injury.

Keywords: 2-ME; 2-methoxyestradiol; 3-NT; 3-nitrotyrosine; 4-HNE; 4-hydroxynonenal; AA; ALT; BSO; CYP2E1; Ethanol; Free radicals; GSH; HE; HIF; HIF prolyl hydroxylase 2; HIF-1α; HPH-2; Hepatotoxicity; IHC; KI; KO; LDHA; MDA; Oxidative stress; PNP; ROS; TBARS; WT; alanine aminotransferase; arachidonic acid; cytochrome P450 2E1; hematoxylin–eosin; hypoxia-inducible factor; immunohistochemistry; knock-in; knockout; l-buthionine sulfoximine; lactate dehydrogenase A; malondialdehyde; p-nitrophenol; reactive oxygen species; reduced glutathione; thiobarbituric acid-reactive substances; wild type.


Figures

Fig. 1
Fig. 1. Metabolic Changes After Chronic Ethanol Feeding
WT, CYP2E1 KO and CYP2E1 KI mice were fed ethanol or dextrose for 4 weeks. (A) Histopathology. Panel A6 show severe pathological changes including hepatocyte ischemic necrosis and infiltration of inflammatory cells in central zone of the hepatic lobule (arrows, HE×200). Panels A2 and A4 show mild pathological changes including simple liver steatosis. Panels A1, A3 and A5 show minimal steatosis and no obvious pathological changes (HE×200). (B) serum ALT. (C) Ratio of liver to body weight. * p<0.05, ** p<0.01 compared to the CYP2E1 KI group fed dextrose. # p<0.05 compared to CYP2E1 KO or WT group fed ethanol or dextrose.
Fig. 2
Fig. 2. CYP2E1 Levels and Oxidative Stress After Chronic Ethanol Feeding
(A) CYP2E1 catalytic activity assayed with para-nitrophenol. (B) CYP2E1 protein levels. (C) MDA level in mitochondria. (D) Immunohistochemical staining for 4-HNE in liver. Panel D6 shows strong 4-HNE positive staining (arrows, IHC×200). Other panels show little or no obvious positive staining. (E) GSH level in mitochondria. (F) Immunohistochemical staining for 3-NT in liver. Panel D6 show strong 3-NT positive staining (arrows, IHC×200). Panel D4 show weak 3-NT positive staining (arrow, IHC×200). Other panels show no obvious positive staining * p<0.05, ** p<0.01 compared to the CYP2E1 KI groups fed dextrose. # p<0.05, ## p<0.01 compared to CYP2E1 KO or WT groups fed ethanol or dextrose. & p<0.05 compared to WT group fed dextrose.
Fig. 3
Fig. 3. Levels of HIF-1α and HPH-2 protein After Chronic Ethanol Feeding
(A) Nuclear protein levels of HIF-1α and HPH-2. (B) HIF-1α mRNA level. Note no significant difference between all groups. (C) Immunohistochemical staining for HIF-1α in the liver. Panel C6 shows strong HIF-1a staining in the KI mice (+++) fed with ethanol (arrows, Fig. 3C), moderate HIF-1a staining in the WT mice (++)(Fig. 3C4, arrows, IHC×300) and weak or no positive staining in KO mice (Fig. 3C5, IHC×300) fed with ethanol. No obvious positive staining was observed in the dextrose-fed mice (−) (Fig. 3C1,3C2,3C3). * p<0.05, ** p< 0.01 compared to the CYP2E1 KI groups fed dextrose. # p< 0.05 compared to CYP2E1 KO or WT groups fed ethanol or dextrose.
Fig. 4
Fig. 4. Levels of HIF-1α Downstream Targets and Pimonidazole Staining After Chronic Ethanol Feeding
(A) The levels of Bcl-2, P21 and LDHA protein. Levels of p21 were very low and could not be reproducibly detected except for the ethanol-fed KI mice. Levels of LDHA could not be reproducibly detected in the dextrose-fed WT mice. The ratio of LDHA/β-actin for the ethanol-fed WT mice was taken as 1.0, to be compared to the other groups. (B) Immunohistochemical staining of the hypoxia-marker pimonidazole in liver. Panel 4B6 shows strongly hypoxia positive staining in liver of the KI mice (+++) (arrows, IHCx300). Panel 4B2 shows hypoxia positive staining in WT mice (+) (arrows, IHCx300) fed with ethanol. Panel 4B4 or 4B1,4B3,4B5 show no positive staining in the KO mice (−) fed with ethanol or in any of the dextrose-fed mice. (C) Fluorescent double staining of hypoxia-specific pimondazole and CYP2E1 in hepatic centrilobule. Panels 1 and 2 show co-location (yellow) of hypoxia (yellowish green, IHCx400) and CYP2E1 (red, IHCx400) in the same centrilobular area of the liver in the KI mice fed with ethanol * p< 0.05, *** P <0.001 compared to the CYP2E1 KI groups fed dextrose. # p<0.05, ### p< 0.001 compared to CYP2E1 KO or WT groups fed ethanol or dextrose.
Fig. 5
Fig. 5. HIF-1α and HPH-2 Protein Levels After Acute Ethanol Treatment
(A) Nuclear protein levels of HIF-1α and HPH-2. (B) Immunohistochemical staining for HIF-1α in the liver of WT, CYP2E1 KO and CYP2E1 KI mice treated with acute ethanol or saline. Panel B6 shows strong staining for HIF-1α in pericentral areas of livers of the ethanol-gavaged KI mice (+++) (arrows, IHCx300). Panel B4 show moderate staining for HIF-1α in the ethanol gavaged WT mice (arrows, IHCx300). Panel B3 shows weaker staining in the saline gavaged KI mice (arrows, IHCx300). Panels B1, B2 or B5 show no obvious HIF-1α positive staining in ethanol or saline treated KO mice or saline treated WT mice. * p<0.05 compared to the CYP2E1 KI groups treated with saline. # p<0.05, ## p<0.01 compared to CYP2E1 KO or WT groups treated with ethanol or saline.
Fig. 6
Fig. 6. Toxicity of Ethanol, Ethanol + AA or Ethanol + BSO in E47/C34 HepG2 Cells in the Absence and Presence of the HIF-1α Inhibitor 2-ME
E47 cells which express CYP2E1 and C34 cells which do not were treated for 48 hours with 100 mM ethanol alone or ethanol plus 30 μM AA or ethanol plus 300 μM BSO in the absence or presence of the HIF-1α inhibitor 45 μM 2-ME. (A,C): Cell viability was assayed by a MTT assay. (B, D): Protein levels of HIF-1α and HPH-2 from nuclear extracts of E47/C34 cells. * p<0.05 compared to ethanol treatment alone in E47 cells. # p<0.05 compared to E47 cells treated with ethanol plus AA or ethanol plus BSO in the absence of 2-ME. & p<0.05 compared to E47 cells treated with ethanol alone or to C34 cells treated with ethanol plus AA or ethanol plus BSO in the absence of 2-ME.
Fig. 7
Fig. 7. Oxidative Changes in E47/C34 HepG2 Cells in the Absence and Presence of the HIF-1α inhibitor, 2-ME
(A) The level of TBARS in E47 or C34 cells treated with 100 mM ethanol alone or 30 μM AA alone or 300 μM BSO alone or AA plus ethanol or BSO plus ethanol in the absence or presence of the HIF-1α inhibitor 45 μM 2-ME. * p<0.05 compared to E47 cells treated with AA alone or ethanol alone or AA plus ethanol in the absence of 2-ME. # p<0.05 compared to E47 cells treated with BSO alone or BSO plus ethanol in the absence of 2-ME. & p<0.05 compared to C34 cells control without treatment. (B) The positive staining of 5 μM Mitosox in E47/C34 cells treated with AA or ethanol or BSO or AA plus ethanol or BSO plus ethanol in the absence or presence of 2ME was observed under the fluorescence microscope. (Red color, ×100)

References

    1. Semenza GL. Regulation of mammalian oxygen homeostasis by hypoxia- inducible factor 1. Annu Rev Cell Dev Biol. 1999;15:551–578. - PubMed
    1. Semenza GL. Hypoxia-inducible factors in physiology and medicine. Cell. 2012;148:399–408. - PMC - PubMed
    1. Formenti F, Constantin-Tedusoiv D, Emmanuel Y, Cheeseman J, Durrington KL, Edwards LM, Humphreys SM, Lappin TR, McMullin MF, McNamara CJ, Mills W, Murphy JA, O’Connor DF, Percy MJ, Ratcliffe PJ, Smith TG, Treacy M, Frayn KN, Greenhaff PL, Karpe F, Clarke K, Robbins PA. Regulation of human metabolism by hypoxia-inducible factor. Proc Natl Acad Sci USA. 2010;107:12722–12727. - PMC - PubMed
    1. Juan M, Kondo K, Yang H, Kim W, Valiando J, Ohn M, Salic A, Asara JM, Lane WS, Kaelin WG., Jr HIFα targeted for VHL-mediated destruction by proline hydroxylation: implications for oxygen sensing. Science. 2001;292:464–468. - PubMed
    1. Majmudar AJ, Wong WJ, Simon MC. Hypoxia-inducible factors and the response to hypoxia stress. Mol Cell. 2010;40:294–309. - PMC - PubMed

Publication types

MeSH terms

LinkOut - more resources