. 2014 Jan;6(1):1-15.
doi: 10.5249/jivr.v6i1.351. Epub 2013 May 14.

Temporal variation in United States firearm injuries 1993-2008: results from a national data base

Affiliations

Temporal variation in United States firearm injuries 1993-2008: results from a national data base

Randall T Loder. J Inj Violence Res. 2014 Jan.

Abstract

Background: There are few studies that address temporal variation in firearm associated injuries. It was the purpose of this study to analyze the temporal variation in the types and patterns of injuries associated with firearm use from a national data base.

Methods: The database used was the Inter-University Consortium for Political and Social Research Firearm Injury Surveillance Study 1993-2008. Emergency department visits associated with firearm use were analyzed for month and day of the week for various demographic variables. Statistical analyses were performed using SUDAAN 10™ software to give national estimates. Temporal variation by month or day was assessed using histograms, circular distributions, and cosinor analyses. Variation by month and day combined were analyzed using three dimensional contours.

Results: There were an estimated 1,841,269 injuries. Circular analyses demonstrated a non-uniform distribution for all parameters for both month and day of injury (p less than 0.001). The overall peak was September 15 with several exceptions. Injuries from BB guns had a peak on May 22, a diagnosis of a foreign body on July 11, and patients aged 10 to 14 years on April 9.The peak day was always Saturday/Sunday when significant variation existed. There were many different patterns for month and day combined. Some were "a rapidly rising high mountain starting at sea level" (hunting), or others a "series of mountain ranges starting from a high plain or steppe" (hospital admissions).

Conclusions: This study provides altogether new information regarding temporal variation for injuries associated with firearms in the USA. These results can be used to assist medical resource allocation and prevention campaigns. Education campaigns can be emphasized before the peaks for which prevention is desired (eg. BB gun prevention campaigns should be concentrated in March, prior to the April/May peak).


Figures

Figure 1
Figure 1. Cosinor analysis of all firearm injury ED visits (y axis) by month (x axis). The actual data is shown in the black squares, and the cosinor fit by the black line. This fit is represented by the equation. Number ED visits = 153490 + 14379cos((30t-15)-255), where t = 1 is January, 2 is February, etc, and was statistically significant (r2 = 0.69, p = 0.006). The peak is September 15 (arrow).
Figure 2
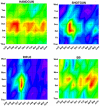
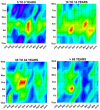
Figure 2. Examples of topographic contours representing month by day data. The number of ED visits are plotted onto a topographic “map” with the month on the x axis, the weekday on the y axis, and the number of ED visits on the z axis (or “elevation” of the contour). Twenty equal “contour elevations” were used to create the “topographic maps”. The lowest contour starting at 0 is purple/pink and the highest contour reaching the maximum number of patients is bright red. The data used in this figure is for those who were involved in hunting activities and sustained firearm injuries. Both three dimensional (A) and two dimensional (B) representations are shown.
Figure 3A
Figure 3A. Injuries occurring at school/places of recreation demonstrated a statistically significant bimodal variation (solid line) with a periodicity of 6 months, represented by the equation: Number ED visits = 4278 + 1380cos(60t - 247), r2 = 0.49, p = 0.049, where t = the month of injury (1 = January, 2 = February, 3 = March, 4 = April, 5 = May, 1 = June, 2 = July, etc). The closed squares represent the actual number of ED visits per month. A unimodal fit (hatched line), represented by the equation: Number ED visits = 4275 + 1099cos(30t - 293) (r2 0.31, p = 0.19), was not statistically significant. The two peaks in the bimodal model correspond to May 5 and November 4 (solid arrows).
Figure 3B
Figure 3B. Injuries due to law enforcement activity demonstrated a statistically significant bimodal variation (solid line) with a periodicity of 6 months, represented by the equation: Number ED visits = 1782 + 249cos(60t - 239), r2 = 0.51, p = 0.039. The closed triangles represent the actual number of ED visits per month. A unimodal fit (hatched line), represented by the equation: Number ED visits = 1781 + 165cos(30t - 125) (r2 0.23, p = 0.31), was not statistically significant. The two peaks in the bimodal model correspond to May 1 and October 31 (solid arrows).
Figure 4
Figure 4. Cosinor fits for those injured with rifles (black squares and solid black line) and while hunting (open triangles and hatched line). There were statistically significant fits for both rifles (Number ED visits = 9136 + 4035cos((30t-15)-307), r2 = 0.50, p = 0.042, peak November 17) and hunting (Number ED visits = 2991+ 3723cos((30t-15)-317), r2 = 0.62, p = 0.013, peak November 7) although the month of November was a significant outlier for both (outlined by the dotted octagon).
Figure 5
Figure 5. Three dimensional topographic contour for those who were admitted to the hospital for injuries associated with a firearm. Note the starting level of 4800 patients “medium altitude plain” with various “rising mountain ranges”, the tallest one at 10,377 patients (Saturday/Sunday in October/November), but also with 2 other peaks (Saturday in January, and Saturday/Sunday in May/June).
A:
A:
Whites and Africans.
B:
B:
Geographic location of injury.
C:
C:
By firearm type.
D:
D:
By perpetrator.
E:
E:
By marital status
F:
F:
By age group.
G:
G:
By incident type.
H:
H:
Shot and not shot.
I:
I:
By hospital stratum.

References

    1. Ary RD, Waldrop RD, Harper DE. The increasing burden of pediatric firearm injuries on the emergency department. Pediatr Emerg Care. 1996 Dec;12(6):391–3. - PubMed
    1. Zautcke JL, Morris RW, Koenigsberg M, Carmody T, Stein-Spencer L, Erickson TB. Assaults from penetrating trauma in the state of lllinois. Am J Emerg Med. 1998 Oct;16(6):553–6. - PubMed
    1. Blumenthal R. Suicidal gunshot wounds to the head: a retrospective review of 406 cases. Am J Forensic Med Pathol. 2007 Dec;28(4):288–91. - PubMed
    1. Mattila VM, Mäkitie I, Pihlamamäki H. Trends in hospitalization for firearm-related injury in Finland from 1990 to 2003. J Trauma. 2006 Nov;61(5):1222–7. - PubMed
    1. Cowey A, Mitchell P, Gregory J, Maclennan I, Pearson R. A review of 187 gunshot wound admissions to a teaching hospital over a 54-month period: training and service implications. Ann R Coll Surg Engl. 2004 Mar;86(2):104–7. - PMC - PubMed

Publication types