. 2013 Jul;162(3):1529-38.
doi: 10.1104/pp.113.217984.

TWIN SISTER OF FT, GIGANTEA, and CONSTANS have a positive but indirect effect on blue light-induced stomatal opening in Arabidopsis

Affiliations

TWIN SISTER OF FT, GIGANTEA, and CONSTANS have a positive but indirect effect on blue light-induced stomatal opening in Arabidopsis

Eigo Ando et al. Plant Physiol. 2013 Jul.

Abstract

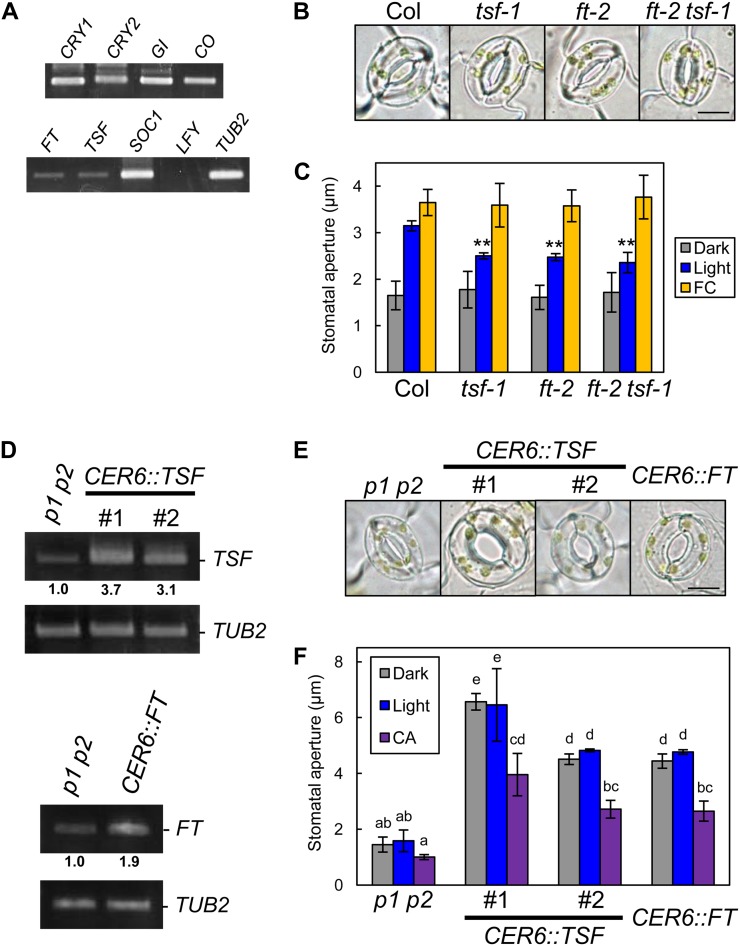
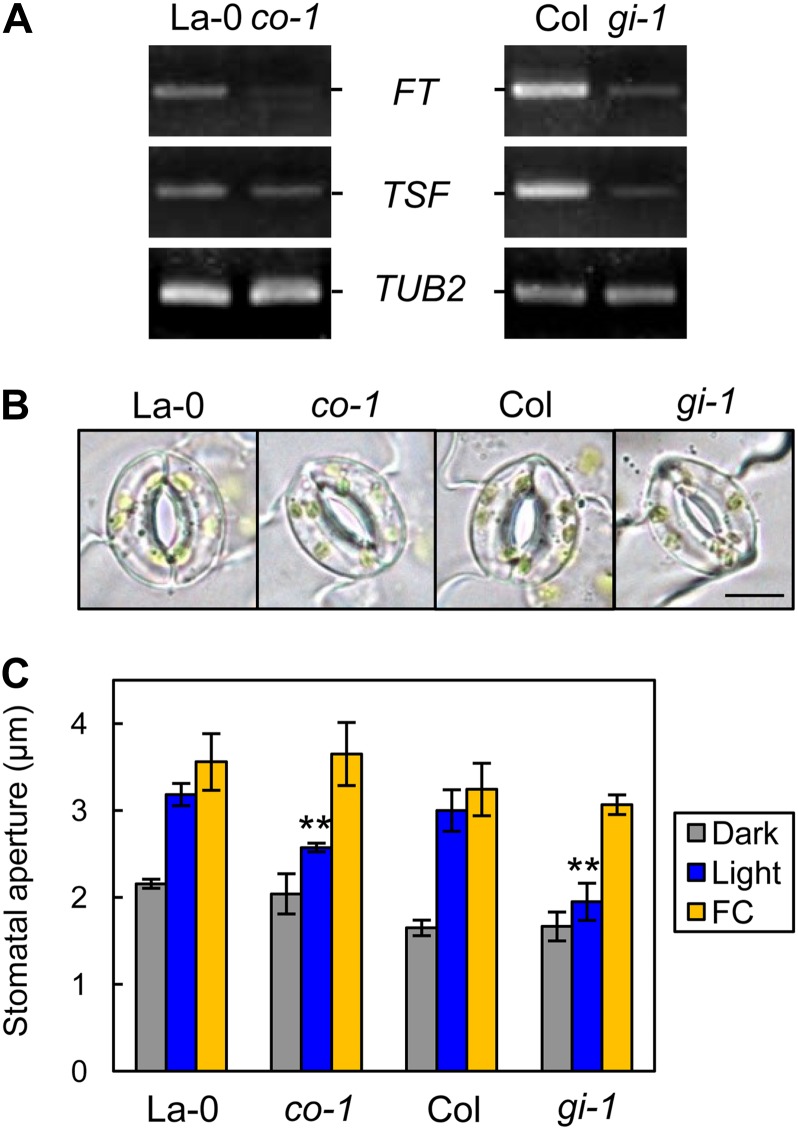
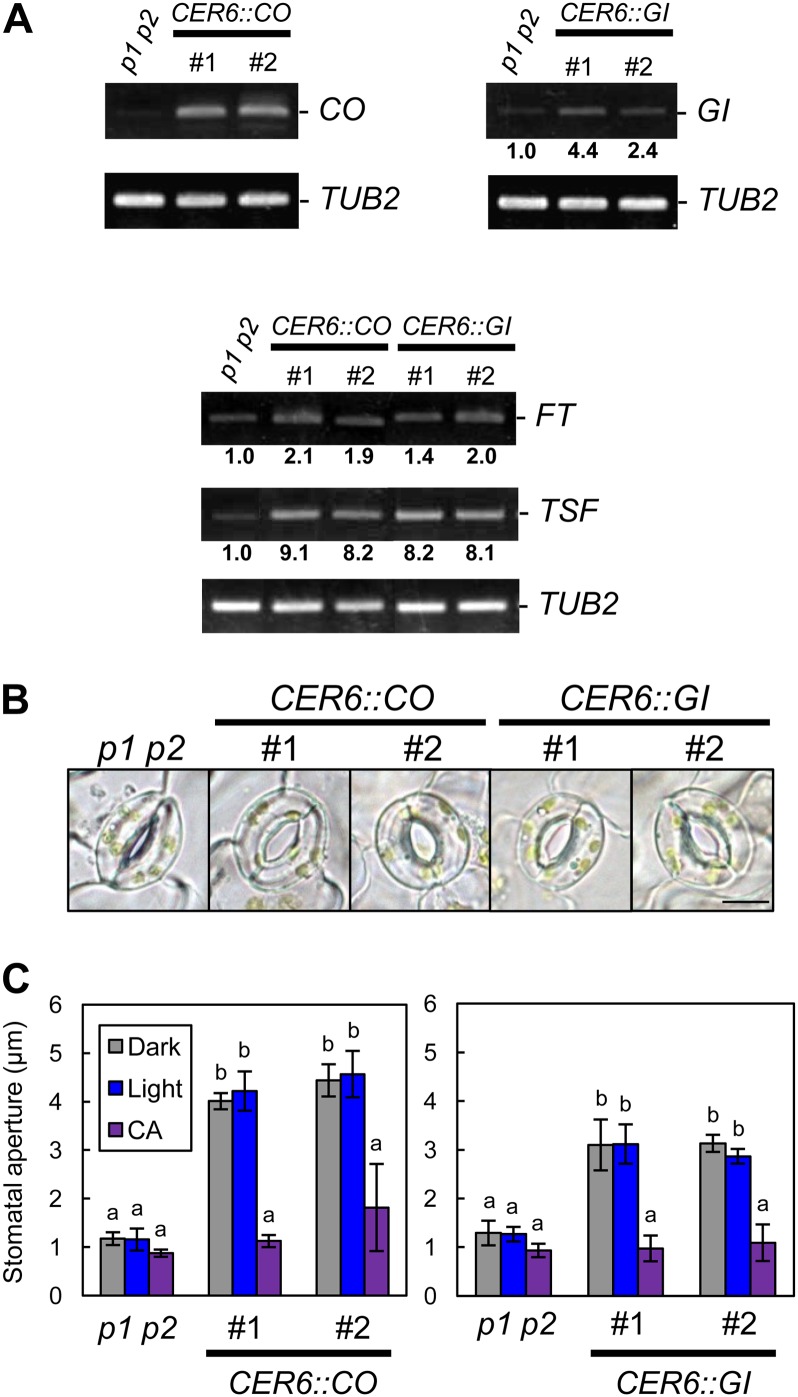
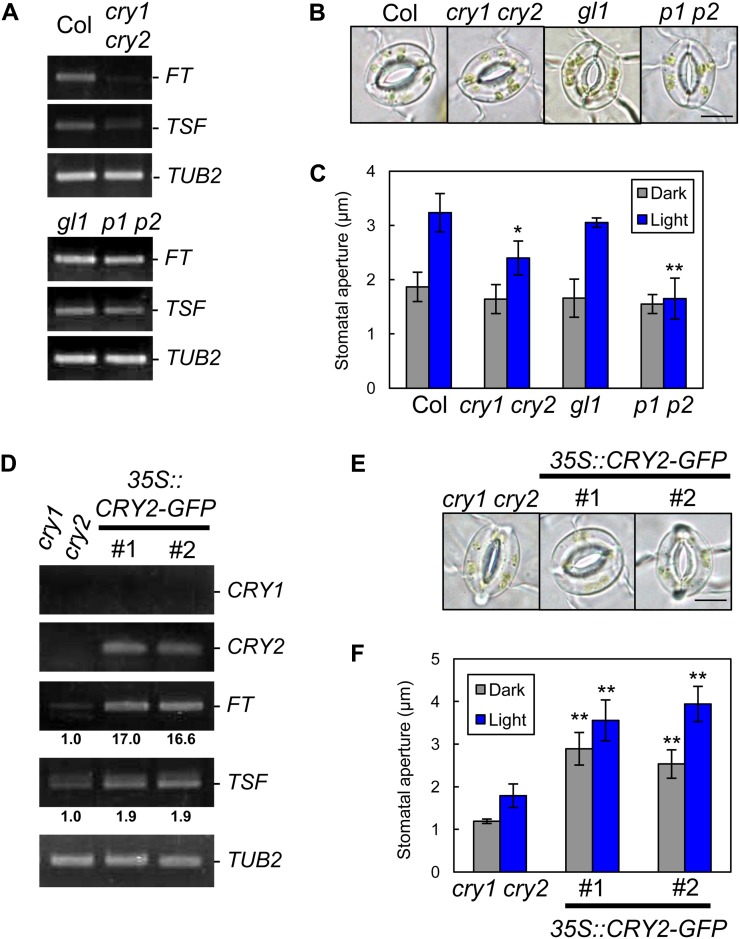
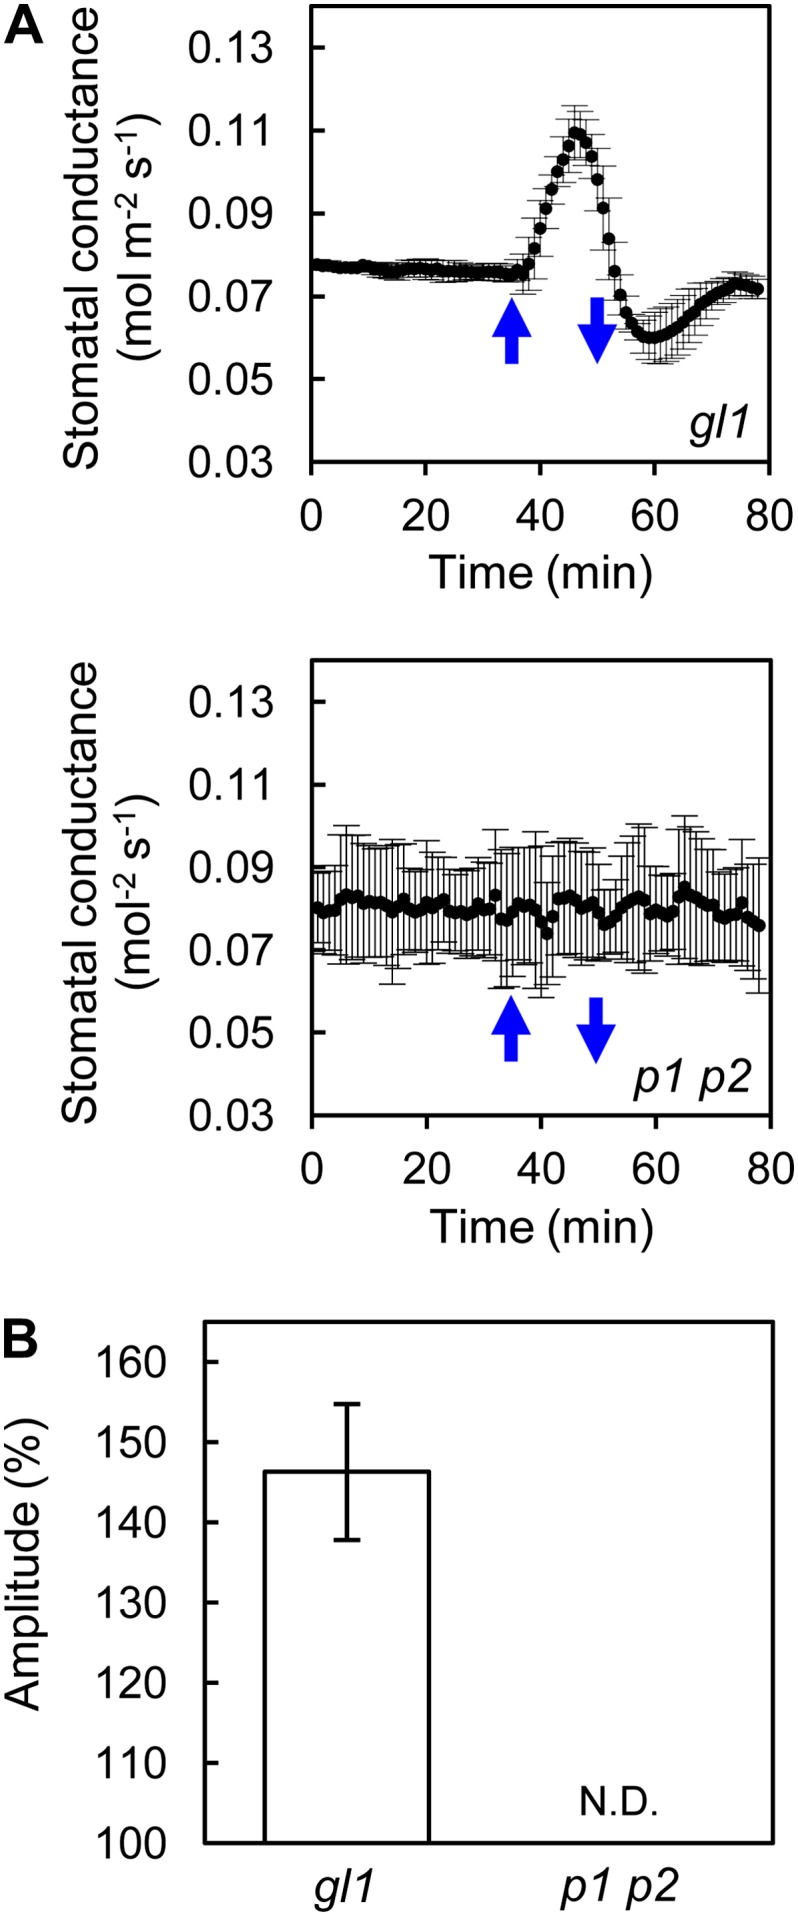
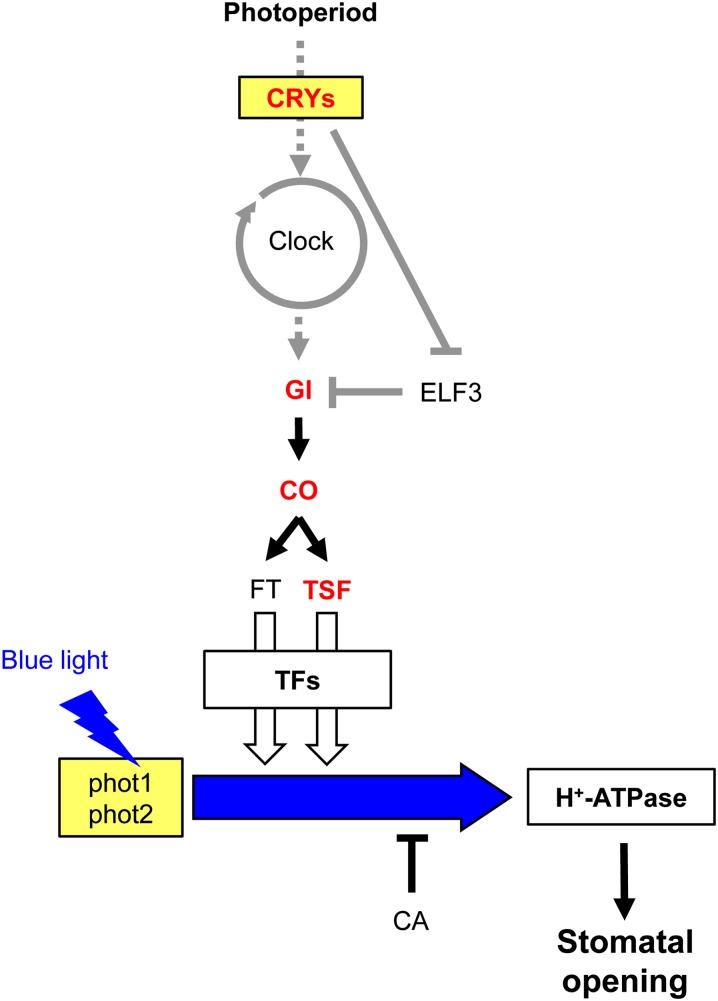
FLOWERING LOCUS T (FT) is the major regulatory component controlling photoperiodic floral transition. It is expressed in guard cells and affects blue light-induced stomatal opening induced by the blue-light receptor phototropins phot1 and phot2. Roles for other flowering regulators in stomatal opening have yet to be determined. We show in Arabidopsis (Arabidopsis thaliana) that TWIN SISTER OF FT (TSF), CONSTANS (CO), and GIGANTEA (GI) provide a positive effect on stomatal opening. TSF, which is the closest homolog of FT, was transcribed in guard cells, and light-induced stomatal opening was repressed in tsf-1, a T-DNA insertion mutant of TSF. Overexpression of TSF in a phot1 phot2 mutant background gave a constitutive open-stomata phenotype. Then, we examined whether CO and GI, which are upstream regulators of FT and TSF in photoperiodic flowering, are involved in stomatal opening. Similar to TSF, light-induced stomatal opening was suppressed in the GI and CO mutants gi-1 and co-1. A constitutive open-stomata phenotype was observed in GI and CO overexpressors with accompanying changes in the transcription of both FT and TSF. In photoperiodic flowering, photoperiod is sensed by photoreceptors such as the cryptochromes cry1 and cry2. We examined stomatal phenotypes in a cry1 cry2 mutant and in CRY2 overexpressors. Light-induced stomatal opening was suppressed in cry1 cry2, and the transcription of FT and TSF was down-regulated. In contrast, the stomata in CRY2 overexpressors opened even in the dark, and FT and TSF transcription was up-regulated. We conclude that the photoperiodic flowering components TSF, GI, and CO positively affect stomatal opening.


Figures

Figure 1.
Figure 1.
TSF is transcribed in guard cells and provides positive regulation of stomatal opening. A, Reverse transcription (RT)-PCR analyses of flowering components (CRY1, CRY2, COP1, GI, CO, FT, TSF, SOC1, and LFY) in GCPs. TUBELIN BETA CHAIN2 (TUB2) was used as a control. B, Typical stomata in Col, tsf-1, ft-2, and the ft-2 tsf-1 double mutant. The epidermis was illuminated as described below. Bar = 10 µm. C, Stomatal apertures under different treatments. Epidermal fragments were kept in the dark (Dark), illuminated with 10 µmol m–2 s–1 blue light under a background 50 µmol m–2 s–1 red light (Light), or treated with 10 µm FC in the dark (FC) for 3 h. Data represent means of three independent experiments with sd. Asterisks indicate significant differences between each mutant and Col under the same condition (**P < 0.01; Student’s t test). D, RT-PCR analyses of FT, TSF, and TUB2 in leaf epidermal fragments of phot1 phot2 (p1 p2), pCER6::TSF/phot1 phot2 (CER6::TSF), and pCER6::FT/phot1 phot2 (CER6::FT). #, Line number of transgenic plants. Epidermal fragments were isolated at zeitgeber time 12. Numbers below each signal represent the relative expression levels for the same genes. Signal values of each gene were estimated by ImageJ software (National Institutes of Health) and normalized to those of TUB2 and secondarily normalized to corresponding phot1 phot2 values set to 1.0. Similar results were obtained in independent experiments. E, Typical stomata of phot1 phot2 and the transgenic plants described in D. The epidermis was kept in the dark as in C. Bar = 10 µm. F, Stomatal apertures of the transgenic plants under different treatments. Dark or light conditions were the same as in C. CA was at 0.5 µm. The epidermis was treated with CA under light-exposure conditions for 3 h. Data represent means of three independent experiments with sd. Different letters indicate significant differences among means (P < 0.05; Tukey’s test).
Figure 2.
Figure 2.
Light-induced stomatal opening was suppressed in co-1 and gi-1, and the transcription of FT and TSF was down-regulated. A, RT-PCR analyses of FT, TSF, and TUB2 in leaf epidermal fragments of La-0, co-1, Col, and gi-1. Epidermal fragments were isolated at zeitgeber time 12. B, Typical stomata of the mutant and corresponding background plants described in A. The epidermis was illuminated as described below. Bar = 10 µm. C, Stomatal apertures under different treatments. Epidermal fragments were kept in the dark (Dark), illuminated with 10 µmol m–2 s–1 blue light under a background 50 µmol m–2 s–1 red light (Light), or treated with 10 µm FC in the dark (FC) for 3 h. Data represent means of three independent experiments with sd. Asterisks indicate significant differences between each mutant and the corresponding wild type under the same conditions (**P < 0.01; Student’s t test).
Figure 3.
Figure 3.
Overexpression of CO or GI promoted stomatal opening and the up-regulation of FT and TSF transcription. A, RT-PCR analyses of GI, CO, FT, TSF, and TUB2 in leaf epidermal fragments of phot1 phot2 (p1 p2), pCER6::CO/phot1 phot2 (CER6::CO), and pCER6::GI/phot1 phot2 (CER6::GI). #, Line number of transgenic plants. Epidermal fragments were isolated at zeitgeber time 4 for the detection of CO and GI and at zeitgeber time 12 for FT and TSF. Signal values are estimated as in Figure 1D. B, Typical stomata of phot1 phot2 and the transgenic plants described in A. The epidermis was kept in the dark for 3 h. Bar = 10 µm. C, Stomatal apertures of the transgenic plants under different treatments. Epidermal fragments were kept in the dark (Dark) or illuminated with 10 µmol m–2 s–1 blue light under a background 50 µmol m–2 s–1 red light (Light) for 3 h. CA was at 0.5 µm. The epidermis was treated with CA under light-exposure conditions for 3 h. Data represent means of three independent experiments with sd. Different letters indicate significant differences between the means of phot1 phot2 and each transgenic plant (P < 0.05; Tukey’s test).
Figure 4.
Figure 4.
Regulation of stomatal aperture by cryptochromes is likely to be mediated by the regulation of FT and TSF. A, RT-PCR analyses of FT, TSF, and TUB2 in leaf epidermal tissue of Col, cry1 cry2, gl1, and phot1 phot2 (p1 p2). Epidermal fragments were isolated at zeitgeber time 12. B, Typical stomata of the same plants described in A. The epidermis was illuminated as described below. Bar = 10 µm. C, Stomatal apertures under different treatments. Epidermal fragments were kept in the dark (Dark), illuminated with 10 µmol m–2 s–1 blue light under a background 50 µmol m–2 s–1 red light (Light), or treated with 10 µm FC in the dark (FC) for 3 h. Data represent means of three independent experiments with sd. Asterisks indicate significant differences between each mutant and the corresponding background plants under the same conditions (*P < 0.05, **P < 0.01; Student’s t test). D, RT-PCR analyses of CRY1, CRY2, FT, TSF, and TUB2 in leaf epidermal tissue of cry1 cry2 and CaMV35S::CRY2-GFP/cry1 cry2 (35S::CRY2-GFP). #, Line number of transgenic plants. Epidermal fragments were isolated at zeitgeber time 12. Signal values are estimated as in Figure 1D. E, Typical stomata of the same plants described in D. The epidermis was kept in the dark for 3 h. Bar = 10 µm. F, Stomatal apertures of the transgenic plants under different treatments. Epidermal fragments were kept in the dark (Dark) or illuminated with 10 µmol m–2 s–1 blue light under a background 50 µmol m–2 s–1 red light (Light) for 3 h. Data represent means of three independent experiments with sd. Asterisks indicate significant differences between transgenic plants and cry1 cry2 under the same conditions (**P < 0.01; Student’s t test).
Figure 5.
Figure 5.
Stomatal conductance in phot1 phot2 in response to short-term blue light irradiation. A, Fluctuation of stomatal conductance in phot1 phot2 (p1 p2) and corresponding background plant (gl1) leaves in response to blue light. Leaves were illuminated with a strong red light (550 µmol m–1 s–1) as a background to stabilize the conductance before illumination with blue light. Upward and downward blue arrows indicate the start and termination, respectively, of illumination for 15 min with blue light (20 µmol m–1 s–1 for phot1 phot2 and 5 µmol m–1 s–1 for gl1). Data represent means of three independent experiments with sd. B, Amplitude of the stomatal conductance in response to blue light. The amplitude is shown as a percentage against a steady state set to 100%. Data represent means of three independent experiments with sd. N.D., Not detected.
Figure 6.
Figure 6.
A possible model for FT/TSF-mediated stomatal opening. The photoperiodic pathway is shown with representative components. The blue light signaling pathway between phototropins and the H+-ATPase is shown with a blue arrow. Arrows and T-bars indicate positive and negative regulation, respectively. Dotted arrows represent input and output of the circadian clock. Gene names in red represent components that were directly analyzed in this study. ELF3 and FT were described previously (Kinoshita et al., 2011). TFs represents transcription factors working downstream of FT and TSF, such as an AP1. Gray lines indicate regulatory mechanisms that are reported in previous works. White arrows show a contribution to stomatal opening, and the thickness of the arrows represents the possible degree of the contribution (for details, see text).

References

    1. Abe M, Kobayashi Y, Yamamoto S, Daimon Y, Yamaguchi A, Ikeda Y, Ichinoki H, Notaguchi M, Goto K, Araki T. (2005) FD, a bZIP protein mediating signals from the floral pathway integrator FT at the shoot apex. Science 309: 1052–1056 - PubMed
    1. Ahn JH, Miller D, Winter VJ, Banfield MJ, Lee JH, Yoo SY, Henz SR, Brady RL, Weigel D. (2006) A divergent external loop confers antagonistic activity on floral regulators FT and TFL1. EMBO J 25: 605–614 - PMC - PubMed
    1. Araki T. (2001) Transition from vegetative to reproductive phase. Curr Opin Plant Biol 4: 63–68 - PubMed
    1. Boccalandro HE, Giordano CV, Ploschuk EL, Piccoli PN, Bottini R, Casal JJ. (2012) Phototropins but not cryptochromes mediate the blue light-specific promotion of stomatal conductance, while both enhance photosynthesis and transpiration under full sunlight. Plant Physiol 158: 1475–1484 - PMC - PubMed
    1. Boss PK, Bastow RM, Mylne JS, Dean C. (2004) Multiple pathways in the decision to flower: enabling, promoting, and resetting. Plant Cell (Suppl) 16: S18–S31 - PMC - PubMed

Publication types

MeSH terms