. 2013 Jul 4;122(1):93-9.
doi: 10.1182/blood-2012-11-463257. Epub 2013 May 13.

Subcellular mislocalization of the transcription factor NF-E2 in erythroid cells discriminates prefibrotic primary myelofibrosis from essential thrombocythemia

Affiliations

Subcellular mislocalization of the transcription factor NF-E2 in erythroid cells discriminates prefibrotic primary myelofibrosis from essential thrombocythemia

Konrad Aumann et al. Blood. .

Abstract

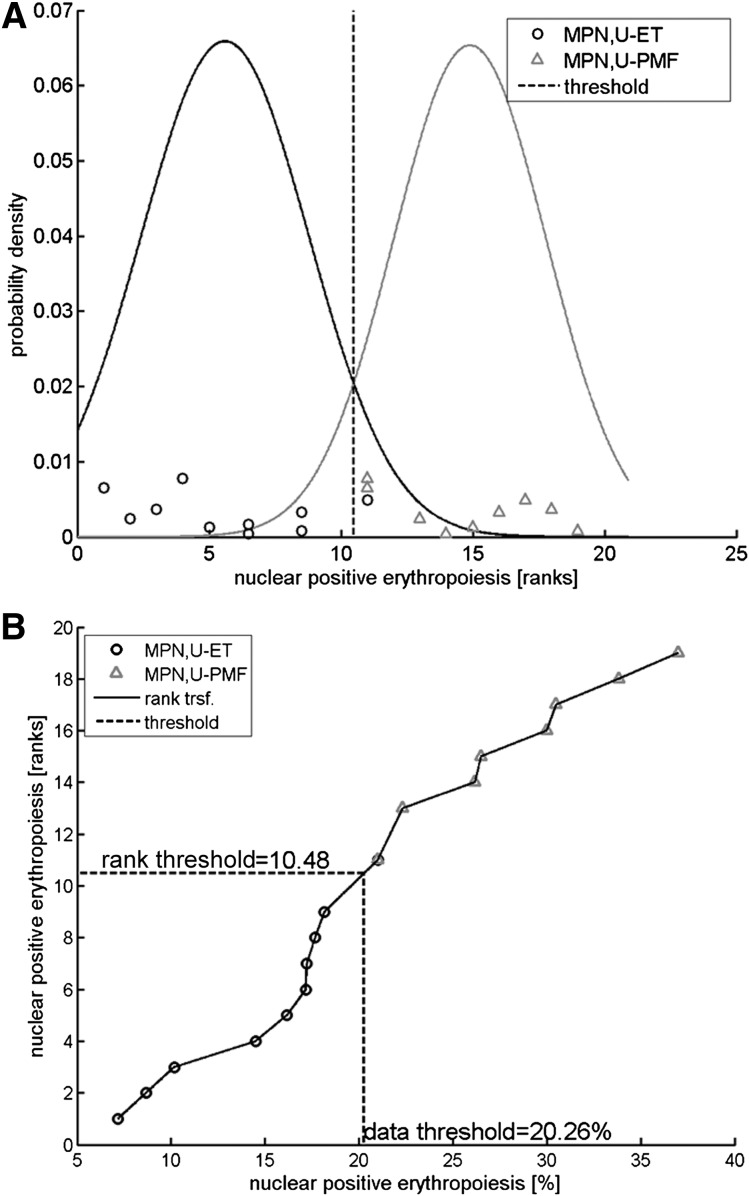
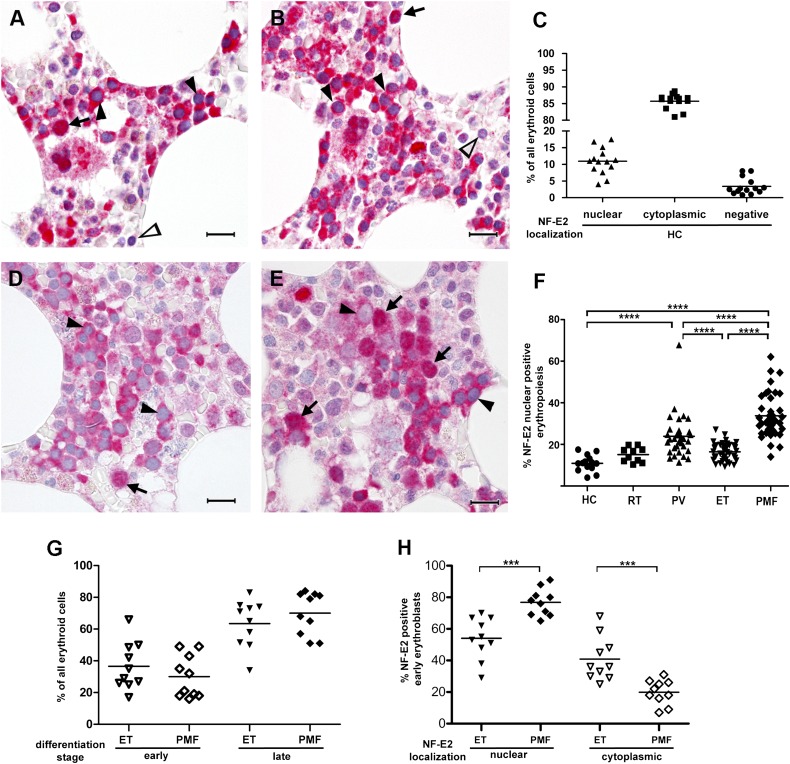
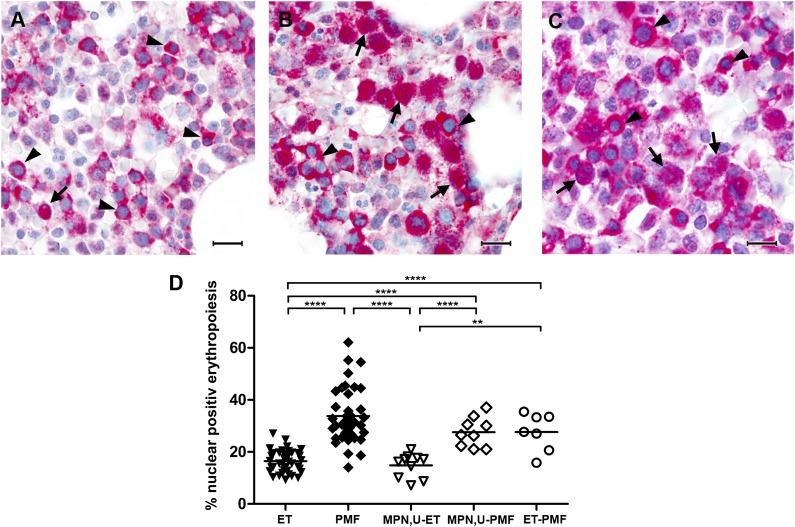
The World Health Organization (WHO) classification of myeloproliferative neoplasms (MPNs) comprises several entities including essential thrombocythemia (ET); primary myelofibrosis (PMF); and MPN, unclassifiable (MPN,U). Differential diagnosis between ET and early, prefibrotic PMF can be challenging but is critical because clinical course and outcome vary considerably between these entities. We have previously shown that the transcription factor nuclear factor erythroid 2 (NF-E2) is aberrantly expressed in MPN patients. Here we demonstrate that NF-E2 is mislocalized in PMF cells and that aberrant NF-E2 localization discriminates statistically highly significantly between ET and PMF. A threshold of 20% nuclear NF-E2 staining was cross-validated by ".682+ bootstrapping." Moreover, this cutoff correctly classifies diagnostic bone marrow biopsies of MPN,U patients specified upon follow-up as ET or PMF with 92% accuracy. Because interobserver concordance between independent pathologists was high (Spearman's rank correlation coefficient, 0.727), we propose that quantitative NF-E2 immunohistochemistry represents a diagnostic tool that can reliably support a differential diagnosis between ET and PMF.


Figures

Figure 1
Figure 1
Rank transformation and threshold calculation. Rank transformations constitute an efficient strategy to perform robust analyses with respect to distributional assumptions. (A) Posterior probability densities for MPN,U-ET and MPN,U-MPF patients fitted to the measurements after rank transformation. A rank transformation of the data was applied to perform the classification analysis. The posterior probability densities are plotted for both MPN,U-ET and MPN,U-PMF patients. The threshold of 10.48 for the ranks is obtained by determining the rank with equal posterior probabilities. (B) Transformation. The threshold value for the ranks (10.48) was translated to the measurement scale. Ranks are plotted in a vertical direction; the horizontal axis denotes the measurements as percent of nuclear-positive cells. The threshold 10.48 for ranks (vertical axis) corresponds to 20.26% nuclear-positive cells (horizontal axis).
Figure 2
Figure 2
Immunohistochemistry of NF-E2 in HCs, RT, ET, PV, and PMF patients. (A-B represent HCs; D represents essential thrombocythemia; E represents PMF) Bone marrow biopsies were stained with an antibody against NF-E2 and counterstained with hematoxylin (original magnification ×1000; the bar indicates 20 µm). Arrows point to erythropoietic cells with nuclear NF-E2 staining, filled arrow heads indicate cytoplasmic NF-E2 staining, and open arrowheads mark cells negative for NF-E2 staining. (C,F-H) One hundred erythropoietic cells in each of 3 high-power fields per bone marrow biopsy (300 erythroid cells total) were evaluated for NF-E2 subcellular localization and/or differentiation stage. (C) Quantitative analysis of NF-E2 subcellular localization in HCs. Shown is the percentage of nuclear or cytoplasmic NF-E2–positive erythroid cells, respectively, and NF-E2–negative cells as a proportion of all erythroid precursors. (F) Quantitative analysis of nuclear NF-E2 positivity in erythroid cells in HC RT, and MPN patients. Shown is the percentage of nuclear NF-E2–positive erythroid cells as a proportion of all erythroid precursors. ****P < .0001 by 2-tailed Wilcoxon test. (G) Proportion of early and late erythroblasts of all erythroid cells in ET and PMF patients. Shown is the percentage of early and late erythroblasts as a proportion of all erythroid cells in ET and PMF patients. An early erythroblast was defined on a CAE stain as a CAE-negative erythroid cell with a small cytoplasm, a large nucleus (1.5-2.5–fold of the diameter of an erythrocyte), and 1 or 2 prominent nucleoli. A late erythroblast was defined as a CAE-negative cell, with abundant cytoplasm, frequently polygonal in shape, and with a round nucleus with dense chromatin. (H) Proportion of NF-E2 nuclear or cytoplasmic positive early erythroblasts in ET and PMF patients. Shown is the percentage of nuclear or cytoplasmic NF-E2–positive cells, as indicated, in early erythroid precursors. ***P < .001 by 2-tailed Wilcoxon test.
Figure 3
Figure 3
Immunohistochemistry of NF-E2 in MPN,U, ET, and PMF patients. Bone marrow biopsies were stained with an antibody against NF-E2 and counterstained with hematoxylin (original magnification ×1000, bar indicates 20 µm). Arrows point to erythropoietic cells with nuclear NF-E2 staining and filled arrowheads indicate cytoplasmic NF-E2 staining. (A) MPN,U later reclassified as ET. (B) MPN,U later reclassified as PMF. (C) ET later reclassified as PMF. (D) Quantitative analysis of NF-E2 immunohistochemistry in MPN,U patients. One hundred erythropoietic cells in each of 3 high-power fields per bone marrow biopsy were evaluated (300 erythroid cells in total). Shown is the percentage of nuclear NF-E2–positive erythroid cells as a proportion of all erythroid precursors. Data for ET and PMF are presented as in Figure 2F; **P < .01, ****P < .0001 by Wilcoxon test.

References

    1. Dameshek W. Some speculations on the myeloproliferative syndromes. Blood. 1951;6(4):372–375. - PubMed
    1. Swerdlow SH, Campo E, Harris NL, et al. WHO Classification of Tumours of Haematopoietic and Lymphoid Tissue. In: Bosman FT, Jaffe ES, Lakhani SR, et al., editors. WHO Classification of Tumours, vol. 4. Lyon, France: IARC Press; 2008.
    1. James C, Ugo V, Le Couédic JP, et al. A unique clonal JAK2 mutation leading to constitutive signalling causes polycythaemia vera. Nature. 2005;434(7037):1144–1148. - PubMed
    1. Baxter EJ, Scott LM, Campbell PJ, et al. Cancer Genome Project. Acquired mutation of the tyrosine kinase JAK2 in human myeloproliferative disorders. Lancet. 2005;365(9464):1054–1061. - PubMed
    1. Kralovics R, Buser AS, Teo SS, et al. Comparison of molecular markers in a cohort of patients with chronic myeloproliferative disorders. Blood. 2003;102(5):1869–1871. - PubMed

Publication types

MeSH terms