

doi: 10.1038/embor.2013.67.
Epub 2013 May 14.
Prdm14 promotes germline fate and naive pluripotency by repressing FGF signalling and DNA methylation
Affiliations
- PMID: 23670199
- PMCID: PMC3701237
- DOI: 10.1038/embor.2013.67
Item in Clipboard
Prdm14 promotes germline fate and naive pluripotency by repressing FGF signalling and DNA methylation
EMBO Rep.
2013 Jul.
Abstract
Primordial germ cells (PGCs) and somatic cells originate from postimplantation epiblast cells in mice. As pluripotency is lost upon differentiation of somatic lineages, a naive epigenome and the pluripotency network are re-established during PGC development. Here we demonstrate that Prdm14 contributes not only to PGC specification, but also to naive pluripotency in embryonic stem (ES) cells by repressing the DNA methylation machinery and fibroblast growth factor (FGF) signalling. This indicates a critical role for Prdm14 in programming PGCs and promoting pluripotency in ES cells.
Conflict of interest statement
The authors declare that they have no conflict of interest.
Figures
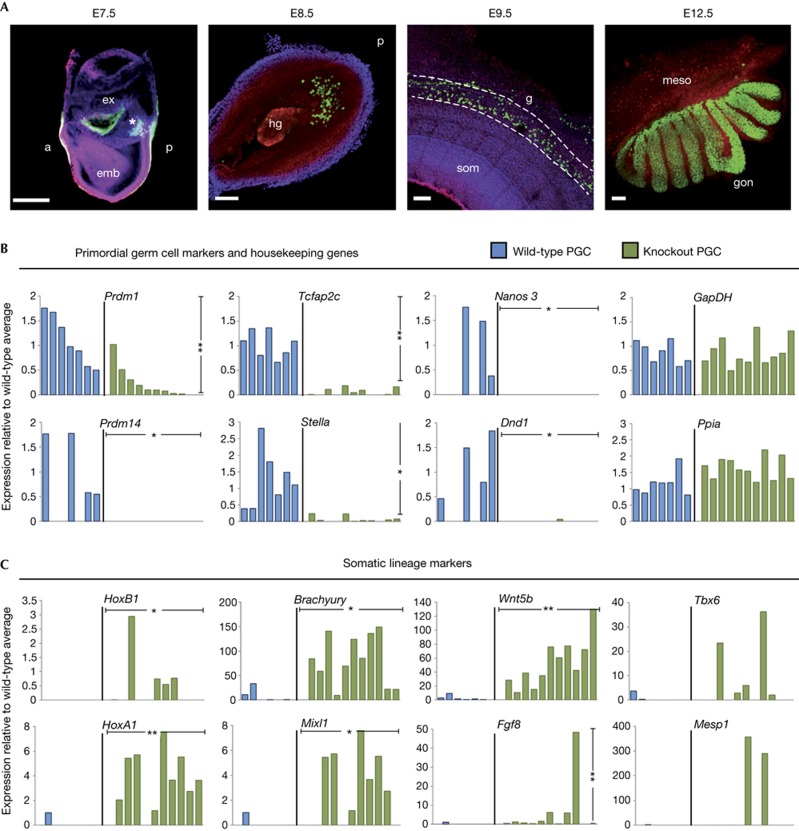
Loss of germline-specific expression and gain of somatic fate markers in Prdm14 mutant PGCs. (A) Stages of wild-type PGC development (PGCs marked by GFP in green). The founder population of PGCs forms a cluster (E7.5; Prdm1-GFP, marked by asterisk), enters the hindgut region (E8.5; Stella-GFP), migrates through the gut (E9.5; Oct4-ΔPE-GFP) and enters into the gonads (E12.5; Oct4-ΔPE-GFP) to continue their development into gametes. (scale bars=100 μm). (B, C) Gene expression levels relative to wild-type average, which is set to 1 (where expression was absent in all wild-type samples, expression levels are relative to knockout average) of individual wild-type (blue) or knockout (green) PGCs. Single cells were ordered according to levels of Prdm1 expression, with values normalized with Arbp. Transcript levels are shown for PGC genes and two housekeeping genes (Gapdh and Ppia; B) and somatic lineage markers (C). Welch’s t-test was used to calculate statistical significances of differences in expression levels (vertical bars) between wild-type and mutant PGCs. The χ2 test was used to determine statistical significances for expression frequency differences (horizontal bars). (*P<0.05; **P<0.01). a, anterior; E, embryonic day, emb, embryonic and ex, extra-embryonic regions; GFP, green fluorescent protein; hg, hindgut; g, gut; som, somites; meso, mesonephros; gon, gonad; PE, primitive endoderm; p, posterior; PGC, primordial germ cells.
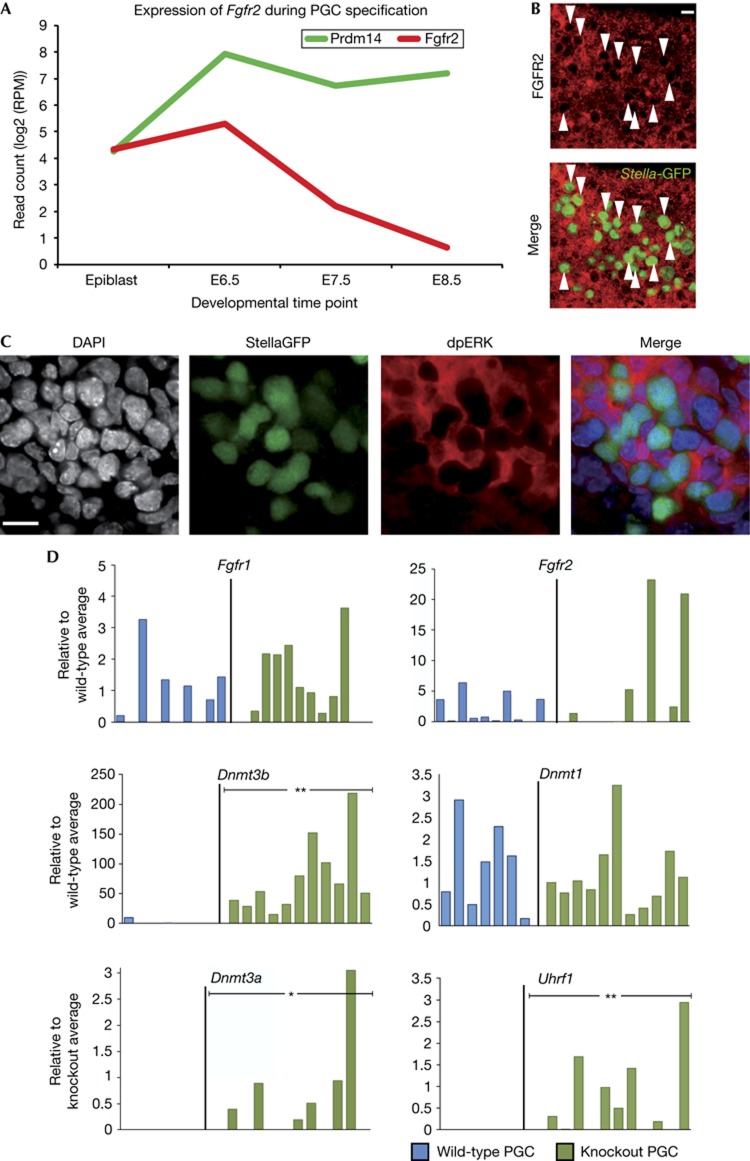
Prdm14-deficient PGCs fail to repress Fgfr2 and DNA methyltransferases. (A) Average changes in transcript levels of Prdm14 and Fgfr2 over the course of PGC specification determined by single-cell RNA sequencing of two wild-type cells. (B) Whole-mount immunostaining for FGFR2 (red) and PGCs, marked by a StellaGFP reporter (green, arrowheads) in an E8.5 wild-type embryo (scale bar=15 μm). (C) Whole-mount immunostaining for PGCs, marked by StellaGFP (green), and phosphorylated ERK (red) in wild-type embryos at E8.75 (scale bar=15 μm). (D) Expression of FGF receptors or genes involved in the regulation of DNA methylation in single wild-type (blue) or knockout (green) PGCs. Expression was normalized with Arbp and is shown relative to the average wild-type level, which was set to 1 (where expression was absent in all wild-type samples, expression levels are relative to knockout average). Statistical significances by χ2 test. (*P<0.05, **P<0.01). DAPI, 4,6-diamidino-2-phenylindole; E, embryonic day; ERK, extracellular signal-regulated kinase; FGF, fibroblast growth factor; GFP, green fluorescent protein; PGC, primordial germ cells.
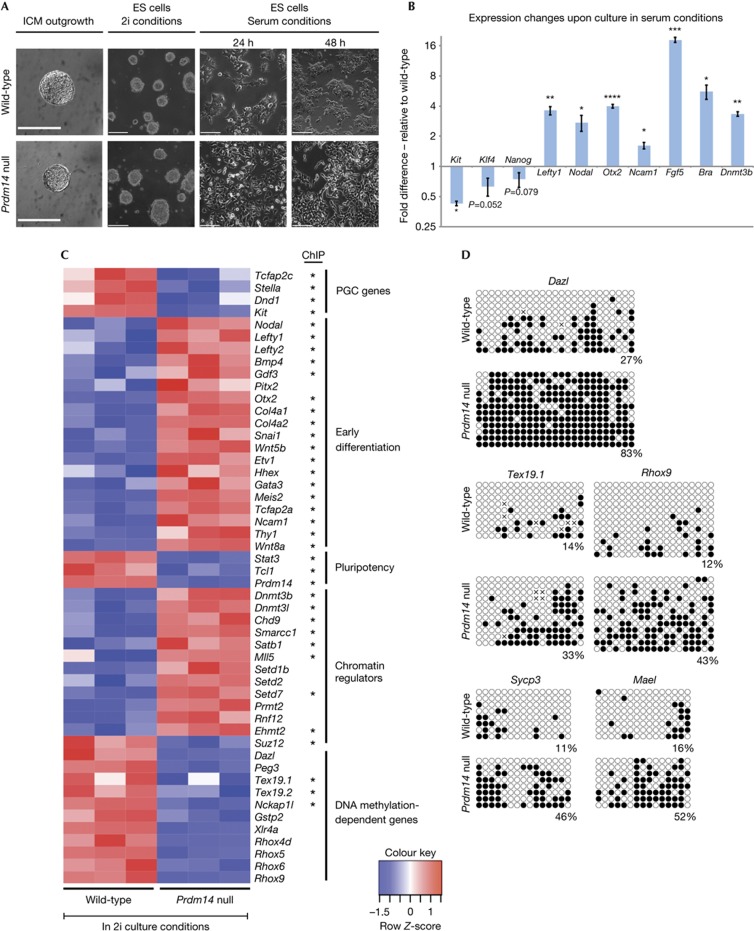
Control of lineage marker expression and DNA methylation by Prdm14 in ES cells. (A) Derivation of Prdm14-null ES cells in 2i culture conditions and morphological changes triggered by a shift to serum culture conditions (scale bar=190 μm for ICM outgrowths and 240 μm for all other images). (B) Gene expression changes induced by culture in serum conditions for 48 h in Prdm14-null ES cells. Values are relative to wild-type cells and normalized to Gapdh (n=three independent biological repeats). Error bars represent the standard error of the mean (s.e.m.) and statistical significance was assessed by t-test (*P⩽0.05; **P⩽0.01; ***P⩽0.001; ****P⩽0.0001) (C) Heatmap of genes with significant expression differences (FDR<0.01) between wild-type and Prdm14-deficient ES cells in 2i culture conditions. Genes determined to be direct target genes by ChIPseq for PRDM14 in mouse ES cells [7] are highlighted by an asterisk. (D) Bisulphite sequencing comparing promoter DNA methylation of DNA methylation-dependent genes in wild-type and Prdm14-null ES cells cultured in 2i conditions. ES, embryonic stem; FDR, false discovery rate; ICM, inner cell mass; PGC, primordial germ cell; s.e.m., standard error of the mean.
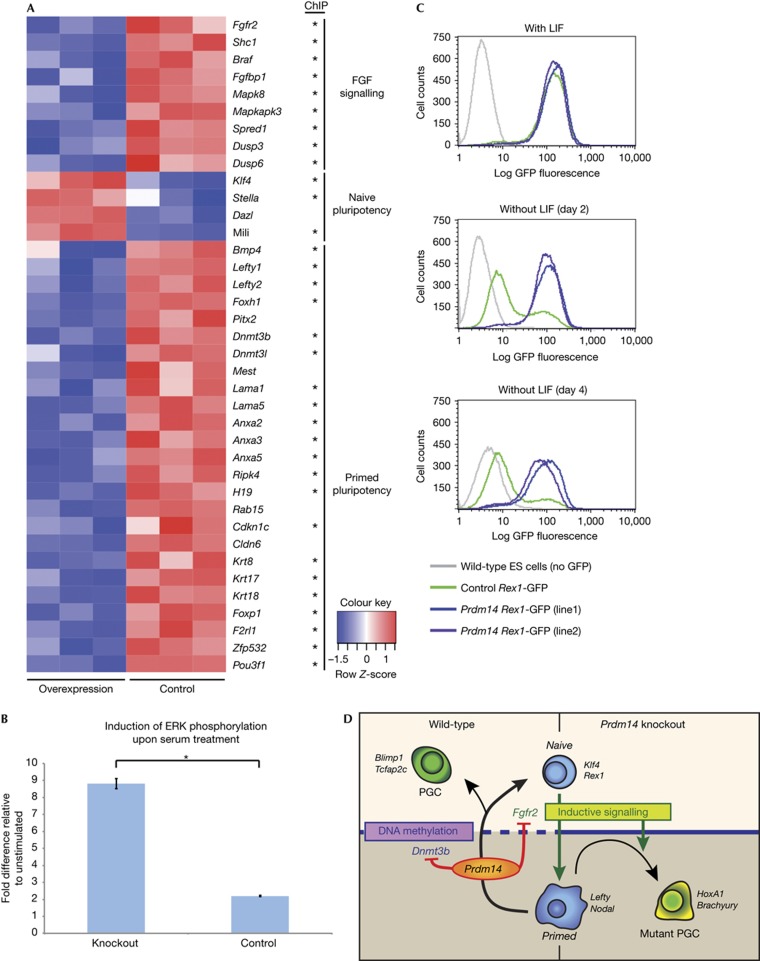
Prdm14 represses lineage markers and renders ES cells partially LIF independent. (A) Heatmap of differentially expressed genes (FDR<0.01) in control versus Prdm14 gain of function ES cells cultured in serum. Genes determined to be direct target genes by ChIPseq for PRDM14 in mouse ES cells [7] are highlighted by an asterisk. (B) Induction of ERK phosphorylation in control and Prdm14-null ES cells upon 15 min serum stimulation. Values show fold change compared to levels in unstimulated cells, as determined by quantitative ELISA assay (n= three independent biological repeats). Error bars show standard error of the mean and statistical significance was assessed by t-test (*P⩽0.05). (C) Flow cytometry analysis of Rex1-GFP levels after 2 and 4 days of LIF withdrawal in serum culture conditions in control ES cells compared to two independent ES cell lines overexpressing Prdm14. Data shown are representative of independent biological repeats, with 100,000 cells profiled for each cell line. (D) Model and summary of Prdm14 function in ES cells and PGCs. ELISA, enzyme-linked immunosorbent assay; ERK, extracellular signal-regulated kinase; ES, embryonic stem; FGF, fibroblast growth factor; GFP, green fluorescent protein; FDR, false discovery rate; PGC, primordial germ cell; s.e.m., standard error of the mean.
References
-
- Ohinata Y et al. (2005) Blimp1 is a critical determinant of the germ cell lineage in mice. Nature 436: 207–213 - PubMed
-
- Weber S et al. (2009) Critical function of AP-2gamma/TCFAP2C in mouse embryonic germ cell maintenance. Biol Reprod 82: 214–223 - PubMed
-
- Yamaji M, Seki Y, Kurimoto K, Yabuta Y, Yuasa M, Shigeta M, Yamanaka K, Ohinata Y, Saitou M (2008) Critical function of Prdm14 for the establishment of the germ cell lineage in mice. Nat Genet 40: 1016–1022 - PubMed
-
- Seki Y, Yamaji M, Yabuta Y, Sano M, Shigeta M, Matsui Y, Saga Y, Tachibana M, Shinkai Y, Saitou M (2007) Cellular dynamics associated with the genome-wide epigenetic reprogramming in migrating primordial germ cells in mice. Development 134: 2627–2638 - PubMed
Publication types
MeSH terms
Substances
Grants and funding
LinkOut - more resources
Full Text Sources
Other Literature Sources
Molecular Biology Databases
Research Materials
