

Association of caesarean delivery with child adiposity from age 6 weeks to 15 years
- PMID: 23670220
- PMCID: PMC5007946
- DOI: 10.1038/ijo.2013.49
Association of caesarean delivery with child adiposity from age 6 weeks to 15 years
Abstract
Objectives: o assess associations of caesarean section with body mass from birth through adolescence.
Design: ongitudinal birth cohort study, following subjects up to 15 years of age.
Setting and participants: Children born in 1991-1992 in Avon, UK who participated in the Avon Longitudinal Study of Parents and Children (ALSPAC) (n=10 219).
Primary outcome: standardized measures of body mass (weight-for length z-scores at 6 weeks, 10 and 20 months; and body mass index (BMI) z-scores at 38 months, 7, 9, 11 and 15 years). Secondary outcome: categorical overweight or obese (BMI: 85th percentile) for age and gender, at 38 months, 7, 9, 11 and 15 years.
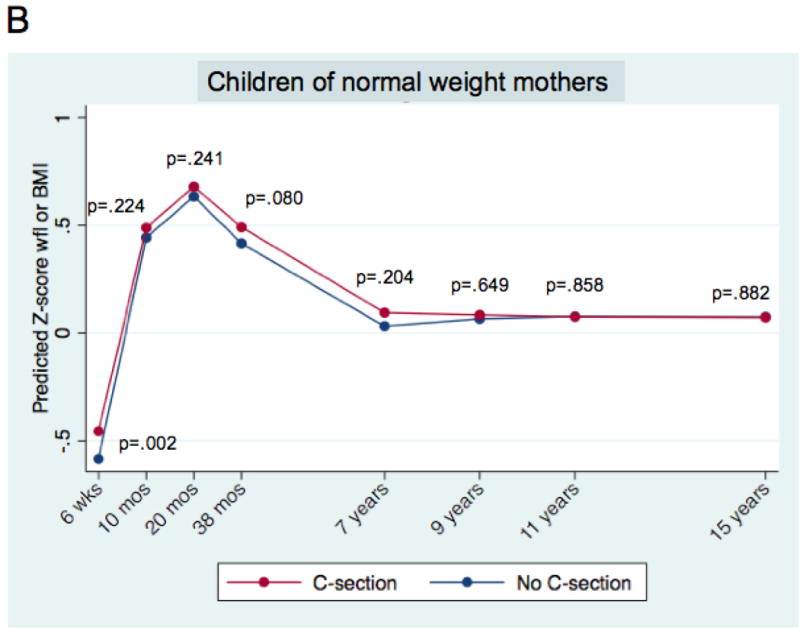
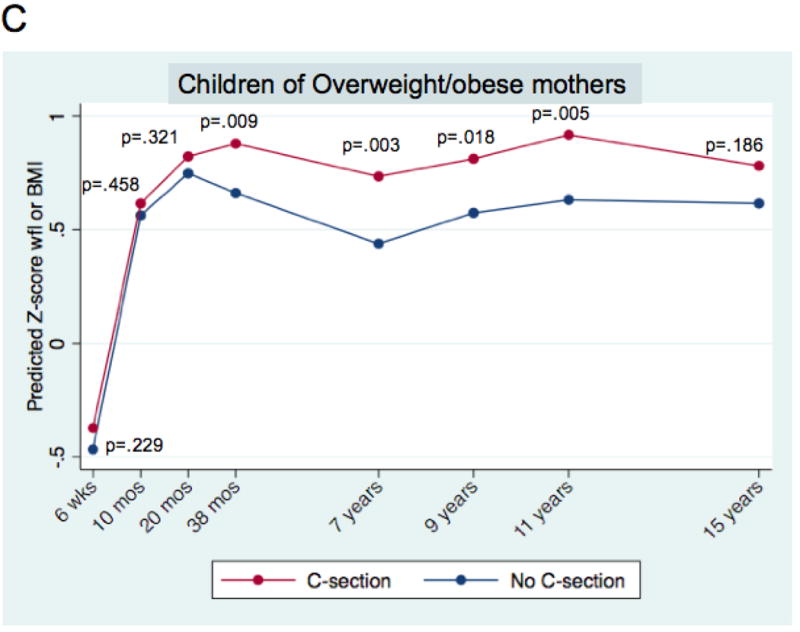
Results: Of the 10 219 children, 926 (9.06%) were delivered by caesarean section. Those born by caesarean had lower-birth weights than those born vaginally (-46.1 g, 95% confidence interval(CI): 14.6-77.6 g; P=0.004). In mixed multivariable models adjusting for birth weight, gender, parental body mass, family sociodemographics, gestational factors and infant feeding patterns, caesarean delivery was consistently associated with increased adiposity, starting at 6 weeks (+0.11 s.d. units, 95% CI: 0.03-0.18; P=0.005), through age 15 (BMI z-score increment+0.10 s.d. units, 95% CI: 0.001-0.198; P=0.042). By age 11 caesarean-delivered children had 1.83 times the odds of overweight or obesity (95% CI: 1.24-2.70; P=0.002). When the sample was stratified by maternal pre-pregnancy weight, the association among children born of overweight/obese mothers was strong and long-lasting. In contrast, evidence of an association among children born of normal-weight mothers was weak.
Conclusion: Cesarean delivery is associated with increased body mass in childhood and adolescence. Research is needed to further characterize the association in children of normal weight women. Additional work is also needed to understand the mechanism underlying the association, which may involve relatively enduring changes in the intestinal microbiome.
Conflict of interest statement
Competing interest. All authors have completed the Unified Competing Interest form at www.icmje.org/coi_disclosure.pdf (available on request from the corresponding author) and declare: all authors had financial support from the NYU Global Public Health Research Fund for the submitted work, and MJB/LMK had financial support from the National Institutes of Health [NIH], as described in the acknowledgements and the Diane Belfer Program in Human Microbial Ecology; no financial relationships with any organisations that might have an interest in the submitted work in the previous 3 years; no other relationships or activities that could appear to have influenced the submitted work.
Figures


References
-
- Keeler EB, Brodie M. Economic incentives in the choice between vaginal delivery and cesarean section. Milbank Q. 1993;71:365–404. - PubMed
-
- Lauer JA, Betran AP, Merialdi M, Wojdyla D. Determinants of caesarean section rates in developed countries: supply, demand and opportunities for control. 2010 Available at http://www.who.int/healthsystems/topics/financing/healthreport/29Determi... (Accessed 2 July 2012)
-
- Niino Y. The increasing cesarean rate globally and what we can do about it. Biosci Trends. 2011;5:139–150. - PubMed
-
- National Institutes of Health. State-of-the-Science Conference Statement: Cesarean Delivery on Maternal Request March 27–29, 2006. Obestrics & Gynecology. 107:1386–1397. - PubMed
Publication types
MeSH terms
Grants and funding
LinkOut - more resources
Full Text Sources
Other Literature Sources
Medical
