

The spontaneous fluctuation of the excitability of a single node modulates the internodes connectivity: a TMS-EEG study
- PMID: 23670997
- PMCID: PMC6869066
- DOI: 10.1002/hbm.22288
The spontaneous fluctuation of the excitability of a single node modulates the internodes connectivity: a TMS-EEG study
Abstract
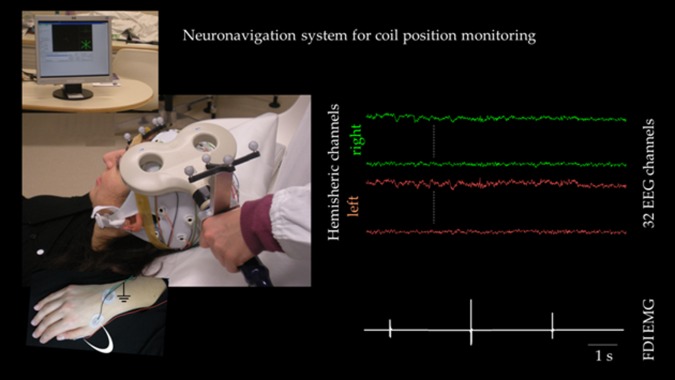
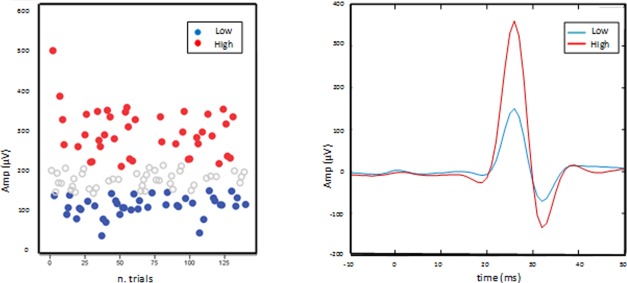
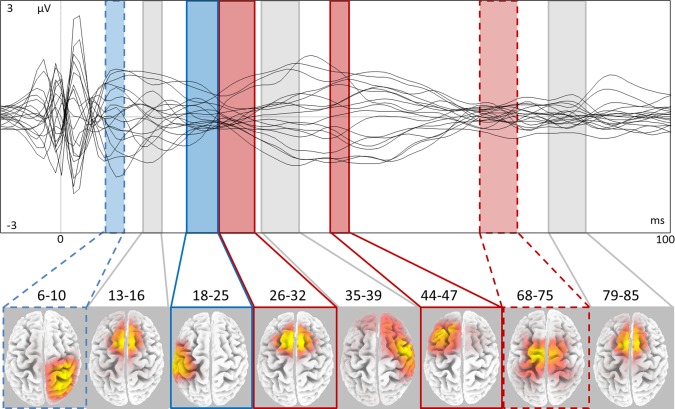
Brain effective connectivity can be tracked by cerebral recruitments evoked by transcranial magnetic stimulation (TMS), as measured by simultaneous electroencephalography (TMS-EEG). When TMS is targeting the primary motor area, motor evoked potentials (MEPs) can be collected from the "target" muscles. The aim of this study was to measure whether or not effective brain connectivity changes with the excitability level of the corticospinal motor pathway (CSMP) as parameterized by MEP amplitude. After averaging two subgroups of EEG-evoked responses corresponding to high and low MEP amplitudes, we calculated the individual differences between them and submitted the grand average to sLORETA algorithm obtaining localized regions of interest (RoIs). Statistical differences of RoI recruitment strength between low and high CSMP excitation was assessed in single subjects. Preceding the feedback arrival, neural recruitment for stronger CSMP activation were weaker at 6-10 ms of homotopic sensorimotor areas BA3/4/5 of the right nonstimulated hemisphere (trend), weaker at 18-25 ms of left parietal BA2/3/40, and stronger at 26-32 ms of bilateral frontal motor areas BA6/8. The proposed method enables the tracking of brain network connectivity during stimulation of one node by measuring the strength of the connected recruited node activations. Spontaneous increases of the excitation of the node originating the transmission within the hand control network gave rise to dynamic recruitment patterns with opposite behaviors, weaker in homotopic and parietal circuits, stronger in frontal ones. The effective connectivity within bilateral circuits orchestrating hand control appeared dynamically modulated in time even in resting state as probed by TMS.
Keywords: cerebral connectivity as localized cortical recruitment; spontaneous fluctuation of excitability; transcranial magnetic stimulation simultaneous to electroencephalographic recordings.
Copyright © 2013 Wiley Periodicals, Inc.
Figures
References
-
- Amassian VE, Maccabee PJ, Cracco RQ (1989): Focal stimulation of human peripheral nerve with the magnetic coil: A comparison with electrical stimulation. Exp Neurol 103:282–289. - PubMed
-
- Barbati G, Porcaro C, Zappasodi F, Rossini PM, Tecchio F (2004): Optimization of an independent component analysis approach for artifact identification and removal in magnetoencephalographic signals. Clin Neurophysiol 115:1220–1232. - PubMed
-
- Barker AT, Freeston IL, Jalinous R, Jarratt JA (1985): Clinical evaluation of conduction time measurements in central motor pathways using magnetic stimulation of human brain. Lancet 1:1325–1326. - PubMed
-
- Bender S, Basseler K, Sebastian I, Resch F, Kammer T, Oelkers‐Ax R, Weisbrod M (2005): Electroencephalographic response to transcranial magnetic stimulation in children: Evidence for giant inhibitory potentials. Ann Neurol 58:58–67. - PubMed
Publication types
MeSH terms
LinkOut - more resources
Full Text Sources
Other Literature Sources
