. 2013 May 28;110(22):8882-7.
doi: 10.1073/pnas.1307237110. Epub 2013 May 13.

Hypoxic and Ras-transformed cells support growth by scavenging unsaturated fatty acids from lysophospholipids

Affiliations

Hypoxic and Ras-transformed cells support growth by scavenging unsaturated fatty acids from lysophospholipids

Jurre J Kamphorst et al. Proc Natl Acad Sci U S A. .

Abstract

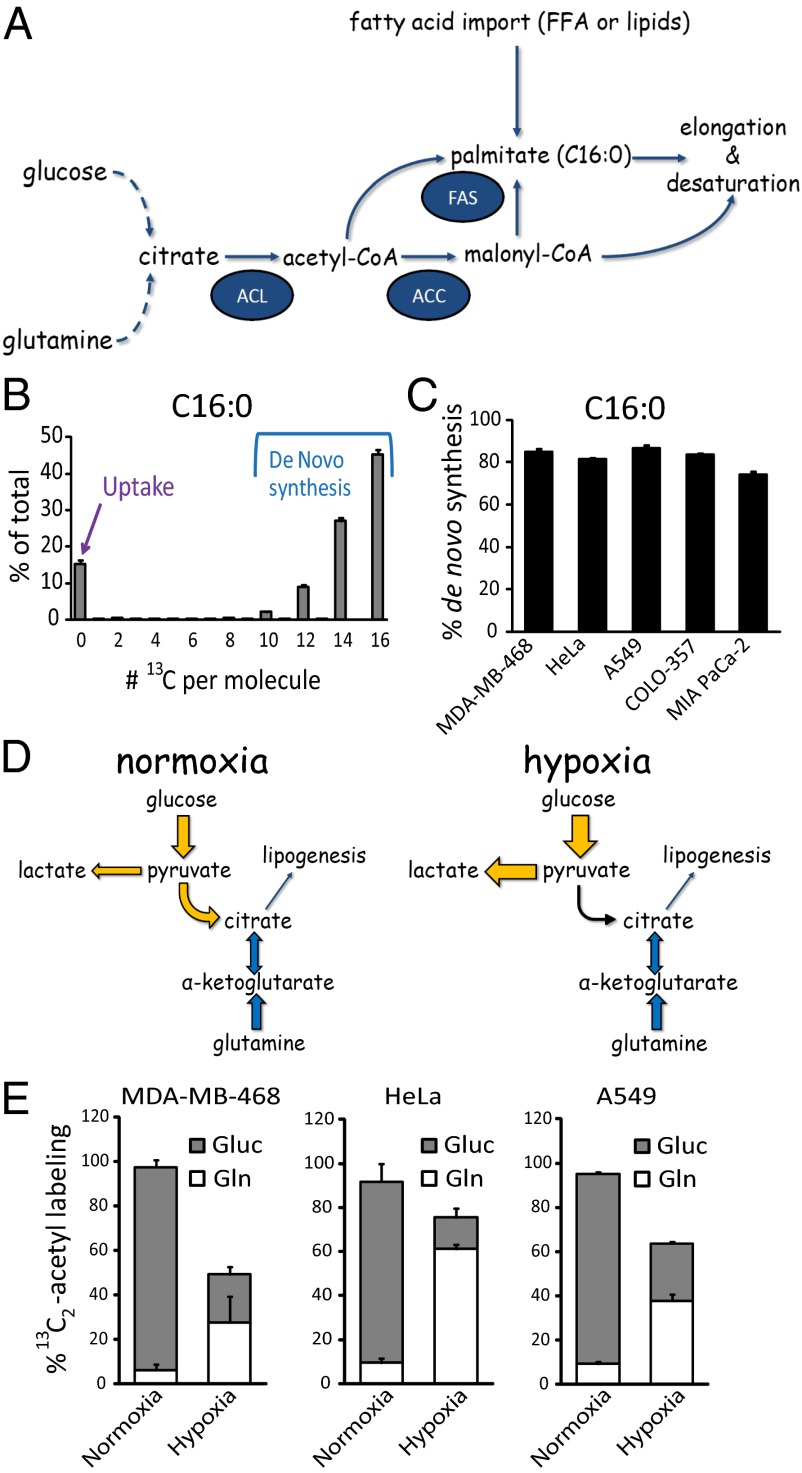
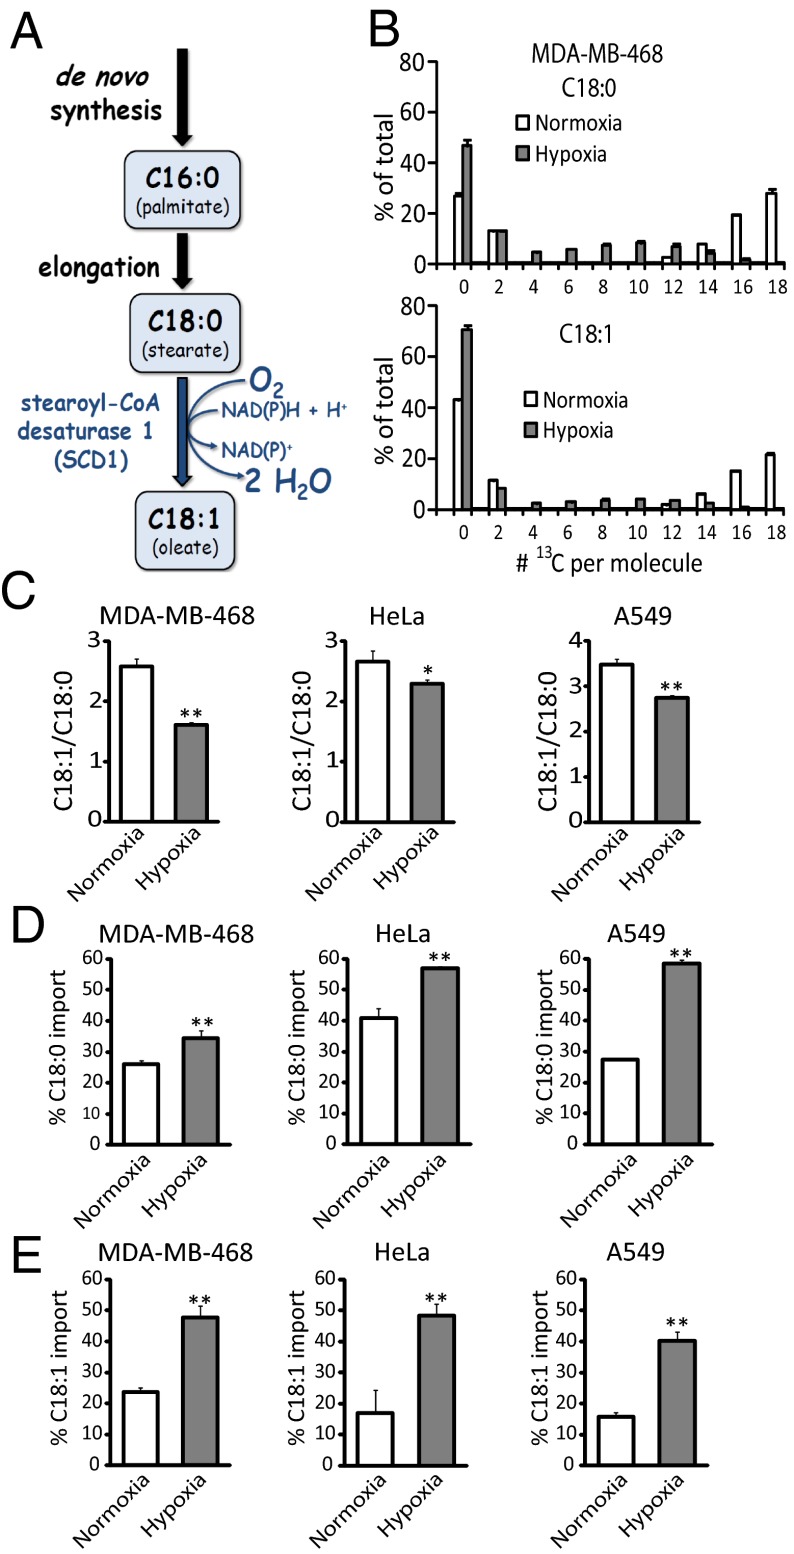
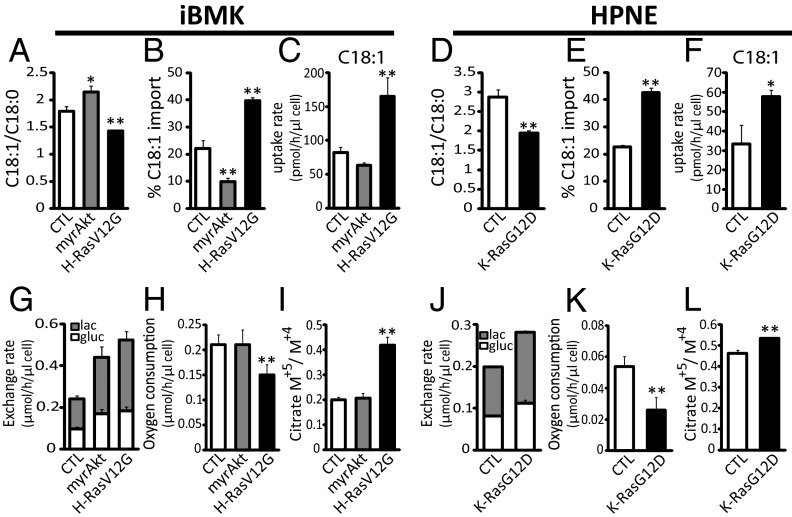
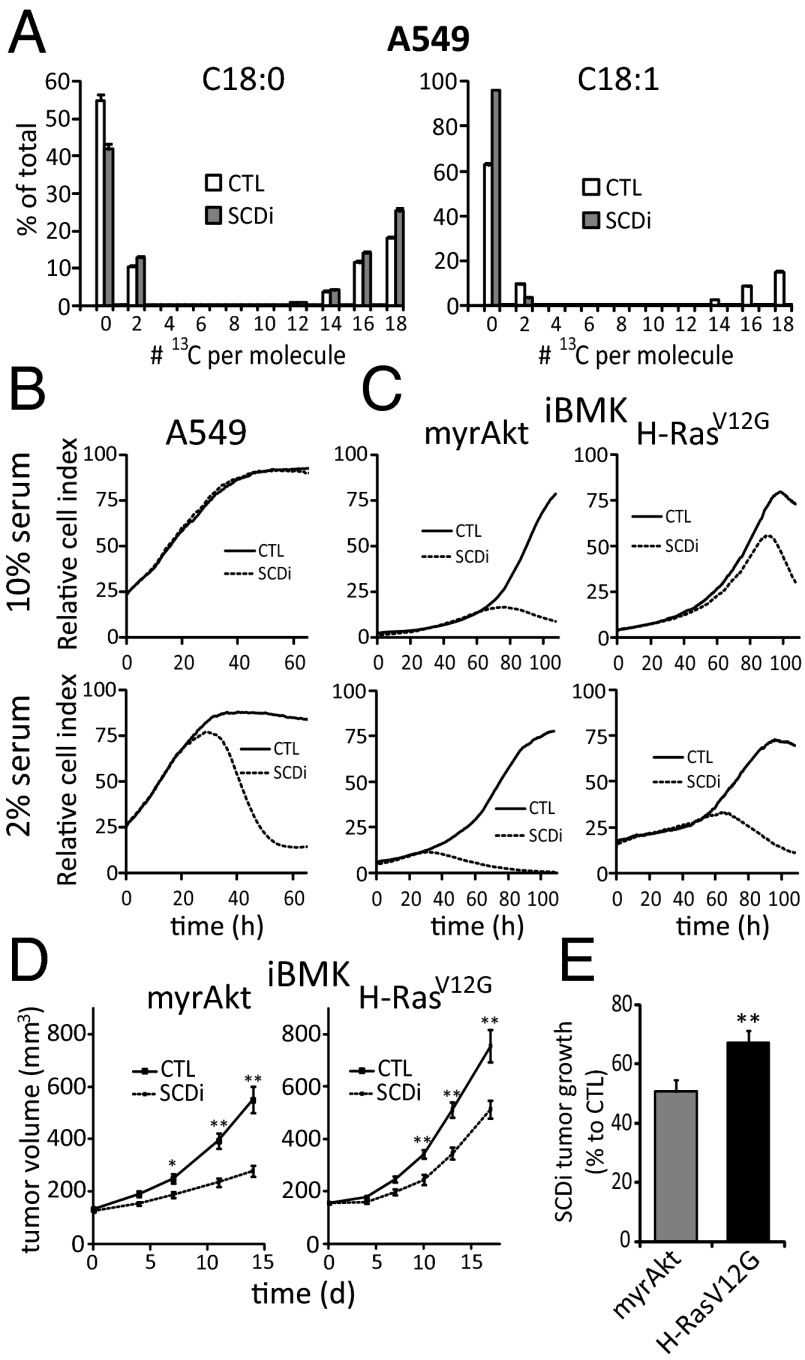
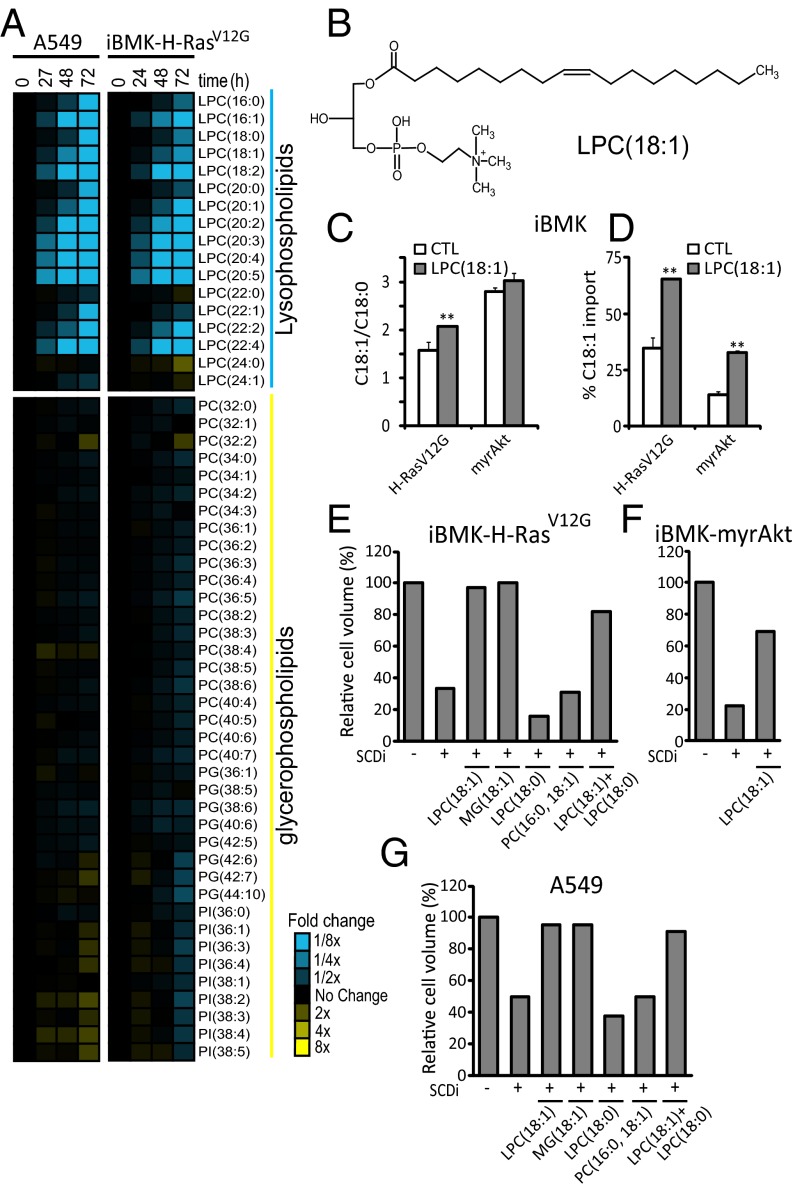
Cancer cell growth requires fatty acids to replicate cellular membranes. The kinase Akt is known to up-regulate fatty acid synthesis and desaturation, which is carried out by the oxygen-consuming enzyme stearoyl-CoA desaturase (SCD)1. We used (13)C tracers and lipidomics to probe fatty acid metabolism, including desaturation, as a function of oncogene expression and oxygen availability. During hypoxia, flux from glucose to acetyl-CoA decreases, and the fractional contribution of glutamine to fatty acid synthesis increases. In addition, we find that hypoxic cells bypass de novo lipogenesis, and thus, both the need for acetyl-CoA and the oxygen-dependent SCD1-reaction, by scavenging serum fatty acids. The preferred substrates for scavenging are phospholipids with one fatty acid tail (lysophospholipids). Hypoxic reprogramming of de novo lipogenesis can be reproduced in normoxic cells by Ras activation. This renders Ras-driven cells, both in culture and in allografts, resistant to SCD1 inhibition. Thus, a mechanism by which oncogenic Ras confers metabolic robustness is through lipid scavenging.

Keywords: isotope tracing; lipid metabolism; lipogenesis in cancer.


Conflict of interest statement

Conflict of interest statement: C.B.T. is a founder and consultant of Agios Pharmaceuticals and has a financial interest in Agios. C.B.T. is also on the Board of Directors of Merck.

Figures

Fig. 1.
Fig. 1.
Palmitate is mainly synthesized from glucose in normoxia, with increased fractional contribution from glutamine in hypoxia. (A) Schematic representation of de novo palmitate (C16:0) synthesis. ACC, acetyl-CoA carboxylase; ACL, ATP-citrate lyase; FAS, fatty acid synthase; FFA, free fatty acids. (B) Labeling pattern of palmitate (C16:0) saponified from cellular lipids, from MDA-MB-468 cells grown in [U-13C]glucose and [U-13C]glutamine for >five doublings. (C) Percentage of cellular palmitate (C16:0) fatty acid tails acquired through de novo synthesis, based on 13C-labeling patterns as per B. (D) Schematic of the contribution of glucose and glutamine to lipogenesis in normoxia and hypoxia. (E) Percentage of labeling of acetyl groups from [U-13C]glucose (Gluc) and [U-13C]glutamine (Gln) in normoxia and hypoxia (1% O2). Acetyl labeling from N-acetyl-glutamate and glutamate at steady state; analysis of fatty acid labeling gives equivalent results. All data are means ± SD of n = 3.
Fig. 2.
Fig. 2.
Hypoxia decreases SCD1 flux and increases fatty acid import. (A) Schematic of oleate (C18:1) synthesis. (B) Labeling patterns of C18:0 and C18:1 from MDA-MB-468 cells grown in [U-13C]glucose and [U-13C]glutamine, in normoxia and hypoxia (1% O2) for 72 h. (C) Desaturation index (C18:1/C18:0) in normoxia and hypoxia (1% O2 for MDA-MB-468 and HeLa cells and 0.5% for A549 cells). (D and E) Percentage of import of C18:0 (D) and C18:1 (E) pools in normoxia and hypoxia, as measured by fatty acid labeling for 72 h, from [U-13C]glucose and [U-13C]glutamine. All data are means ± SD of n = 3. *P < 0.05; **P < 0.01 (two-tailed t test).
Fig. 3.
Fig. 3.
Oncogenic Ras mimics hypoxia, increasing fatty acid scavenging and acetyl-CoA labeling from glutamine and decreasing oxygen consumption. (A) Desaturation index (C18:1/C18:0) in iBMK isogenic cell lines engineered to express myrAkt or H-RasV12G versus vector control (CTL). (B) Percentage of import of C18:1, as measured by steady-state fatty acid labeling from [U-13C]glucose and [U-13C]glutamine. (C) Uptake rates of C18:1, based on measurements of saponified lipids from fresh and spent medium (10% serum; 72 h of incubation). (DF) Same measurements for HPNE cells with oncogenic K-RasG12D versus vector control (CTL). (G) Glucose uptake and lactate excretion in iBMK cells. gluc, glucose; lac, lactate. (H) Oxygen consumption. (I) Ratio of citrate produced from reductive carboxylation of glutamine-derived α-ketoglutarate (M+5) to oxidative metabolism (M+4). (JL) Same measurements in HPNE cells. All data are means ± SD of n ≥ 3. *P < 0.05; **P < 0.01 (two-tailed t test).
Fig. 4.
Fig. 4.
Differential impact of Ras and Akt on sensitivity to SCD1 inhibition. (A) CAY10566 (200 nM) [SCD1 inhibitor (SCDi)] blocks C18:1 labeling from [U-13C]glucose and [U-13C]glutamine. (B and C) Impact of SCDi on A549, iBMK–H-RasV12G, and iBMK-myrAkt cell growth in xCELLigence instrument. CTL is vehicle control. (D) Growth of allografted iBMK–H-RasV12G and iBMK-myrAkt tumors treated with vehicle (CTL) or SCDi (CAY10566, 2.5 mg/kg orally twice daily). (E) Percentage of growth of iBMK–H-RasV12G and iBMK-myrAkt tumors relative to untreated controls, after 13 and 14 d treatment with SCDi, respectively. For AC, data are means ± SD of n ≥ 3. For D and E, data are means ± SEM of n = 10 mice per group. *P < 0.05; **P < 0.01 (two-tailed t test).
Fig. 5.
Fig. 5.
Fatty acids are scavenged from lysophospholipids. (A) Fold changes in medium phospholipids during growth of A549 and iBMK–H-RasV12G cells (relative to fresh medium with 10% serum). (B) Structure of LPC(18:1). (C) Effect of LPC(18:1) supplementation (20 µM; 72 h) on desaturation index (C18:1/C18:0). (D) Percentage of contribution of import to the cellular C18:1 pool based on [U-13C]glucose and [U-13C]glutamine labeling in iBMK–H-RasV12G and iBMK-myrAkt cells. (EG) Packed cell volume for iBMK–H-RasV12G (E), iBMK-myrAkt (F), and A549 (G) cells [relative to untreated control (CTL)] after 72 h of incubation with or without 200 nM SCDi (CAY10566), in the presence of the indicated supplemented lipids (20 µM). PG, phosphatidylglycerol; PI, phosphatidylinositol. Data are mean n = 3 (A); means ± SD of n = 3 (C and D), and mean n = 2 (EG). *P < 0.05; **P < 0.01 (two-tailed t test).

References

    1. Deberardinis RJ, Sayed N, Ditsworth D, Thompson CB. Brick by brick: Metabolism and tumor cell growth. Curr Opin Genet Dev. 2008;18(1):54–61. - PMC - PubMed
    1. Vander Heiden MG, Cantley LC, Thompson CB. Understanding the Warburg effect: The metabolic requirements of cell proliferation. Science. 2009;324(5930):1029–1033. - PMC - PubMed
    1. Shaw RJ, Cantley LC. Ras, PI(3)K and mTOR signalling controls tumour cell growth. Nature. 2006;441(7092):424–430. - PubMed
    1. Gingras A-C, Raught B, Sonenberg N. Regulation of translation initiation by FRAP/mTOR. Genes Dev. 2001;15(7):807–826. - PubMed
    1. Luyimbazi D, et al. Rapamycin regulates stearoyl CoA desaturase 1 expression in breast cancer. Mol Cancer Ther. 2010;9(10):2770–2784. - PMC - PubMed

Publication types

MeSH terms