. 2013 Jul 1;591(13):3355-70.
doi: 10.1113/jphysiol.2013.254128. Epub 2013 May 13.

Paired-pulse facilitation at recurrent Purkinje neuron synapses is independent of calbindin and parvalbumin during high-frequency activation

Affiliations

Paired-pulse facilitation at recurrent Purkinje neuron synapses is independent of calbindin and parvalbumin during high-frequency activation

Grit Bornschein et al. J Physiol. .

Abstract

Paired-pulse facilitation (PPF) is a dynamic enhancement of transmitter release considered crucial in CNS information processing. The mechanisms of PPF remain controversial and may differ between synapses. Endogenous Ca(2+) buffers such as parvalbumin (PV) and calbindin-D28k (CB) are regarded as important modulators of PPF, with PV acting as an anti-facilitating buffer while saturation of CB can promote PPF. We analysed transmitter release and PPF at intracortical, recurrent Purkinje neuron (PN) to PN synapses, which show PPF during high-frequency activation (200 Hz) and strongly express both PV and CB. We quantified presynaptic Ca(2+) dynamics and quantal release parameters in wild-type (WT), and CB and PV deficient mice. Lack of CB resulted in increased volume averaged presynaptic Ca(2+) amplitudes and in increased release probability, while loss of PV had no significant effect on these parameters. Unexpectedly, none of the buffers significantly influenced PPF, indicating that neither CB saturation nor residual free Ca(2+) ([Ca(2+)]res) was the main determinant of PPF. Experimentally constrained, numerical simulations of Ca(2+)-dependent release were used to estimate the contributions of [Ca(2+)]res, CB, PV, calmodulin (CaM), immobile buffer fractions and Ca(2+) remaining bound to the release sensor after the first of two action potentials ('active Ca(2+)') to PPF. This analysis indicates that PPF at PN-PN synapses does not result from either buffer saturation or [Ca(2+)]res but rather from slow Ca(2+) unbinding from the release sensor.


Figures
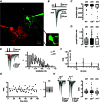
Figure 1
Figure 1. Moderate PPF at WT and mutant synapses
A, two-photon image of PNs connected via recurrent axon collateral. Pre- and postsynaptic cells were filled via somatic whole-cell patch pipettes with red fluorescent Atto-594 or green Atto-488, respectively. Inset: putative presynaptic terminals (white circles). B, example recording from a unitary PN–PN connection. APs elicited in the presynaptic PN (top) and the corresponding postsynaptic responses (bottom; individual traces in grey, average, including failures, in black). C and D, averaged PSC amplitudes (C) and fraction of synaptic failures (D) from WT, CB−/− and PV−/− connections. Boxes show IQR, solid or dashed lines median or mean values, respectively. Whiskers indicate the last data points within 1.5-fold IQR and dots are outliers. The number of experiments (n) per strain is indicated in parentheses. E, left, example of paired-pulse stimulation (5 ms ISI) from a unitary WT PN connection (individual traces in grey, averages in black). PSC amplitudes (red arrows) were determined by fitting products of two exponentials (dashed red lines) to the currents, allowing for subtracting the decay of the first PSC from the peak of the second PSC. Right, corresponding amplitude distribution of first (black) and second (grey) PSCs. F, PPRs plotted against the indicated ISI (median ± SE, n= 8). PPF is evident at high frequency (5 ms). G, stability of PPR (at 5 ms ISI) over the whole-cell recording time. Left, example experiment; the straight line represents the result of a linear regression (r=−0.05). Right, summary of regression analyses of five experiments. Shaded area indicates the 5% level for a significant deviation of r values from 0; dashed line represents the mean r. H, left, examples of paired-pulse experiments (5 ms ISI) on connected CB−/− and PV−/− PNs. Right, averaged PPRs at ISI 5 ms of the different genotypes.
Figure 2
Figure 2. CB but not PV influences the release probability
A, top, multiple probability fluctuation analysis (MPFA) in a pair of connected WT PNs using the indicated [Ca2+]e and, if indicated (+), a submaximal concentration of TEA (1 mm). Solution exchange phases are blanked for clarity. Bottom, corresponding mean–variance relationships of the noise-corrected variances (see Methods) superimposed with a parabolic fit. Error bars show the variance of the variance. B and C, as in A but for pairs of PNs lacking either CB (B) or PV (C). D–F, summary of estimated release probabilities pr (at 2 mm[Ca2+]e in the absence of TEA; *P= 0.046, D), and binominal parameters N (E) and quantal size q (**P= 0.004, F). Solid or dashed lines show median or mean values, respectively.
Figure 5
Figure 5. Suggested mechanism of PPF and estimate of coupling distance
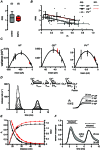
A, PPR (averaged data from 60 to 70 min whole-cell time, Fig. 1D) is not affected by EGTA (P= 0.548), supporting the notion that PPF is not caused by residual free Ca2+. B, PPR vs. pr for all cells (dots) and all [Ca2+]e (median ± SEM) reveals a decline in PPR with increasing pr that was similar in WT and PV−/− and shifted towards increased PPR in CB−/−. PPR values at high pr indicate vesicle replenishment at an ISI of 5 ms. Dashed lines indicate PPR vs. pr relationships of the numerical simulations according to release model 5 (Table S2). C, V–M plots from Fig. 2A–C from WT (left), CB−/− (middle) and PV−/− (right) into which the V–M relationships for second PSC amplitudes recorded at 2 mm[Ca2+]e in the absence of TEA were introduced (red). Note that these data fall close to the parabola for the first amplitudes. D, simulations based on the model of Sakaba (2008) following readjustment to experimental values from WT and mutants (model 5, Table S2). Left, release rates at increasing coupling distances during two APs (from 15 to 150 nm in 5 nm increments). Right, temporal integrals of the release rates at 25 and 30 nm for both APs. E, pr and PPR plotted against coupling distance for WT (black) and CB−/− (red; PV−/− would almost completely overlap with the WT and was omitted for clarity). The thickened segments of the curves indicate the SE range derived by bootstrap analysis of the experimentally obtained values. F, Ca2+ occupancy of the non-releasing states of the sensor (1–5 bound Ca2+ ions) at a coupling distance of 25–30 nm. Note that the sensor has a residual occupancy of 10–20% at the time of the second influx (active Ca2+). Also note that the reduced peak occupancy of non-releasing states during the second AP is due to the release that occurred during the first AP and to the increased release during the second AP. The released fractions are indicated by the dashed lines.
Figure 3
Figure 3. No obvious influence of vesicle depletion or postsynaptic effects on second PSC amplitudes
A, ratio between second PSC amplitudes following a release failure (0_1) or a success (1_1) recorded in 2 mm[Ca2+]e. Values were statistically not different from a concordant distribution around 1.0 (P= 0.063). B, averaged PSCs recorded at 2 mm[Ca2+]e from a WT, CB−/− and PV−/− pair of 0_1 (black) and 1_1 events (grey) with amplitudes being drawn to scale. Note the identical decay kinetics. The data suggest that receptor desensitization is negligible at near physiological [Ca2+]e.
Figure 4
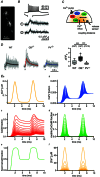
Figure 4. Presynaptic Ca2+ dynamics: experiments and simulation
A, two-photon image of two putative presynaptic collateral terminals from a PN loaded with OGB1 (200 μm pipette concentration). B, fluorescence transients (ΔF/F0) elicited by a train of 10 APs at 200 Hz (evoked by somatic depolarizing voltage steps, top trace) in the putative boutons shown in A. Bottom traces, linescan recordings at 500 Hz (five repetitions in grey, averages in black). C, scheme of the spatially resolved, reaction–diffusion model, covering Ca2+ influx, buffers (including CB, PV, CaM and OGB1), Ca2+ extrusion and the release sensor. D, left panels, averages of 3–5 fluorescence transients per individual bouton (grey) from WT (23 boutons from 7 PNs), CB−/− (18/7) and PV−/− (21/10). Grand averages per strain in dark grey, corresponding simulations in black, red, and blue, respectively. Right, summary of measured peak fluorescence changes (ΔF/F0; median and IQR; ***P < 0.001). E, results of numerical simulations in response to two presynaptic APs in the absence of OGB1. Note differences in scaling from Ea to Ef. Ea, temporal profile of volume-averaged free [Ca2+]i. Ebd, the spatio-temporal profiles of Ca2+-bound fractions of PV (Eb), mobile (0.8) plus immobile (0.2) fractions of CB (Ec), and mobile CaM (Ed) simulated at increasing distances from the site of the Ca2+ influx (10 to 100 nm in 10 nm increments). Ee, Ca2+ occupancy of the fraction (0.2) of CaM assumed to be immobilized in the influx shell. Ef, spatio-temporal profile of free [Ca2+]i (10–100 nm in 10 nm increments).

Comment in

References

    1. Airaksinen MS, Eilers J, Garaschuk O, Thoenen H, Konnerth A, Meyer M. Ataxia and altered dendritic calcium signalling in mice carrying a targeted null mutation of the calbindin D28k gene. Proc Natl Acad Sci U S A. 1997;94:1488–1493. - PMC - PubMed
    1. Atluri PP, Regehr WG. Determinants of the time course of facilitation at the granule cell to Purkinje cell synapse. J Neurosci. 1996;16:5661–5671. - PMC - PubMed
    1. Bertram R, Sherman A, Stanley EF. Single-domain/bound calcium hypothesis of transmitter release and facilitation. J Neurophysiol. 1996;75:1919–1931. - PubMed
    1. Bischofberger J, Geiger JR, Jonas P. Timing and efficacy of Ca2+ channel activation in hippocampal mossy fibre boutons. J Neurosci. 2002;22:10593–10602. - PMC - PubMed
    1. Blatow M, Caputi A, Burnashev N, Monyer H, Rozov A. Ca2+ buffer saturation underlies paired pulse facilitation in calbindin-D28k-containing terminals. Neuron. 2003;38:79–88. - PubMed

Publication types

LinkOut - more resources