

Novel developmental analyses identify longitudinal patterns of early gut microbiota that affect infant growth
- PMID: 23671411
- PMCID: PMC3650000
- DOI: 10.1371/journal.pcbi.1003042
Novel developmental analyses identify longitudinal patterns of early gut microbiota that affect infant growth
Abstract
It is acknowledged that some obesity trajectories are set early in life, and that rapid weight gain in infancy is a risk factor for later development of obesity. Identifying modifiable factors associated with early rapid weight gain is a prerequisite for curtailing the growing worldwide obesity epidemic. Recently, much attention has been given to findings indicating that gut microbiota may play a role in obesity development. We aim at identifying how the development of early gut microbiota is associated with expected infant growth. We developed a novel procedure that allows for the identification of longitudinal gut microbiota patterns (corresponding to the gut ecosystem developing), which are associated with an outcome of interest, while appropriately controlling for the false discovery rate. Our method identified developmental pathways of Staphylococcus species and Escherichia coli that were associated with expected growth, and traditional methods indicated that the detection of Bacteroides species at day 30 was associated with growth. Our method should have wide future applicability for studying gut microbiota, and is particularly important for translational considerations, as it is critical to understand the timing of microbiome transitions prior to attempting to manipulate gut microbiota in early life.
Conflict of interest statement
The authors have declared that no competing interests exist.
Figures
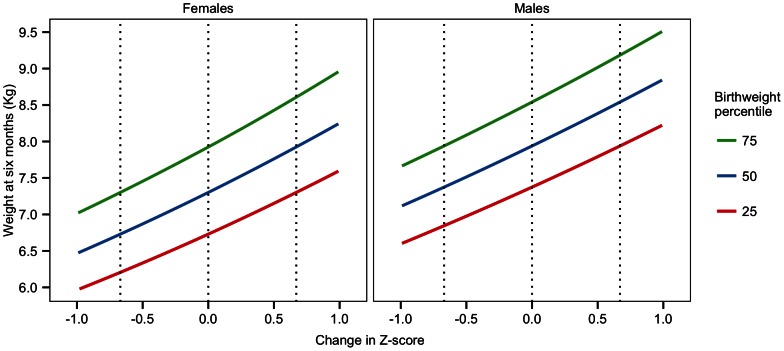
 change in Z-score (x-axis).
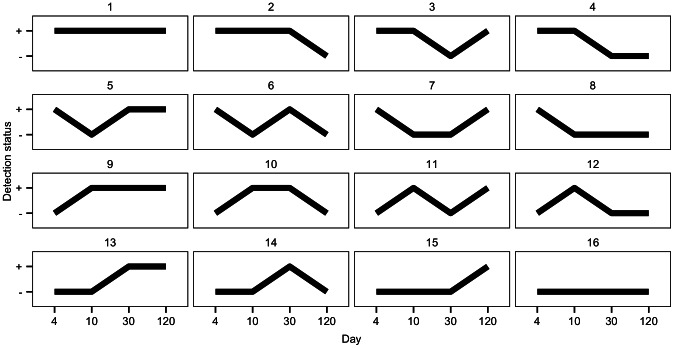
 ” and “
 ” represent detection and non-detection respectively. For example, pattern 8 indicates detection at day 4, followed by non-detection at days 10, 30, and 120.
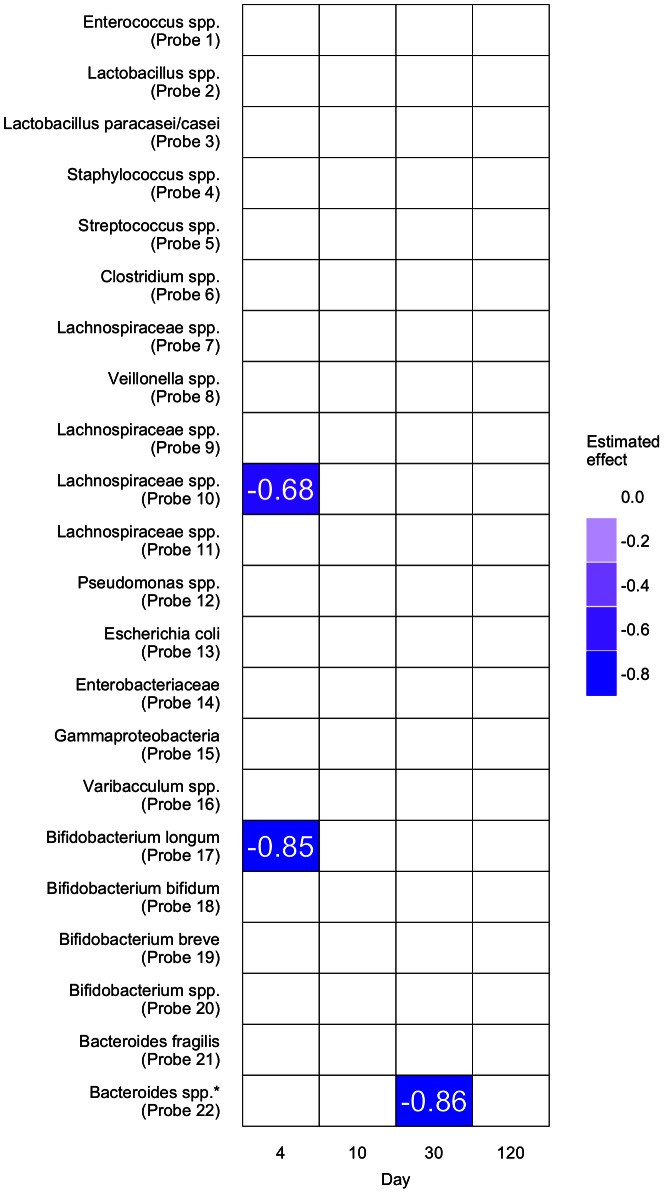
 . Only the results for males are displayed, as no significant results were found for females.
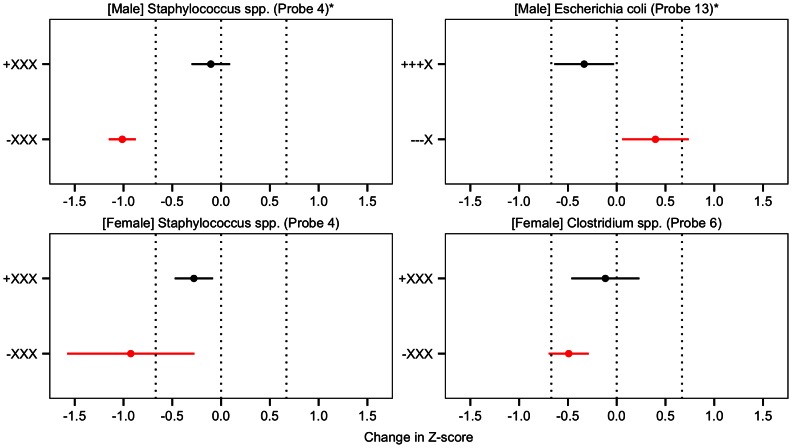
 ”, “
”, “ ”, and “X”, which represent detection, non-detection, and irrelevance, respectively, for the four time points of the analysis (days 4, 10, 30, and 120). The black points and lines represent estimated means and 95% confidence intervals for patterns that were found to be significantly close to zero at an false discovery rate of 5%. The crude contrasts (i.e. if “
 XX” was significant, the crude contrast would be “
 XX”) that were significantly different to zero at
  have their estimated means and 95% confidence intervals displayed in red. For the testing of the difference of the means of the two patterns, significant results (at
  ) is indicated by
  , otherwise significance is
  . Vertical lines are displayed at
  and
and  , representing the boundaries of expected growth.
References
-
- Backhed F, Ley R, Sonnenburg J, Peterson D, Gordon J (2005) Host-bacterial mutualism in the human intestine. Science 307: 1915–20. - PubMed
-
- Mitsuoka T (1992) Intestinal ora and aging. Nutrition Reviews 50: 438–46. - PubMed
-
- Bjorksten B, Naaber P, Sepp E, Mikelsaar M (1999) The intestinal microora in allergic Estonian and swedish 2-year-old children. Clinical and Experimental Allergy 29: 342–6. - PubMed
Publication types
MeSH terms
Grants and funding
LinkOut - more resources
Full Text Sources
Other Literature Sources
Medical
Molecular Biology Databases
