. 2013 May 9;8(5):e61101.
doi: 10.1371/journal.pone.0061101. Print 2013.

Human rotavirus VP6-specific antibodies mediate intracellular neutralization by binding to a quaternary structure in the transcriptional pore

Affiliations

Human rotavirus VP6-specific antibodies mediate intracellular neutralization by binding to a quaternary structure in the transcriptional pore

Mohammed S Aiyegbo et al. PLoS One. .

Abstract

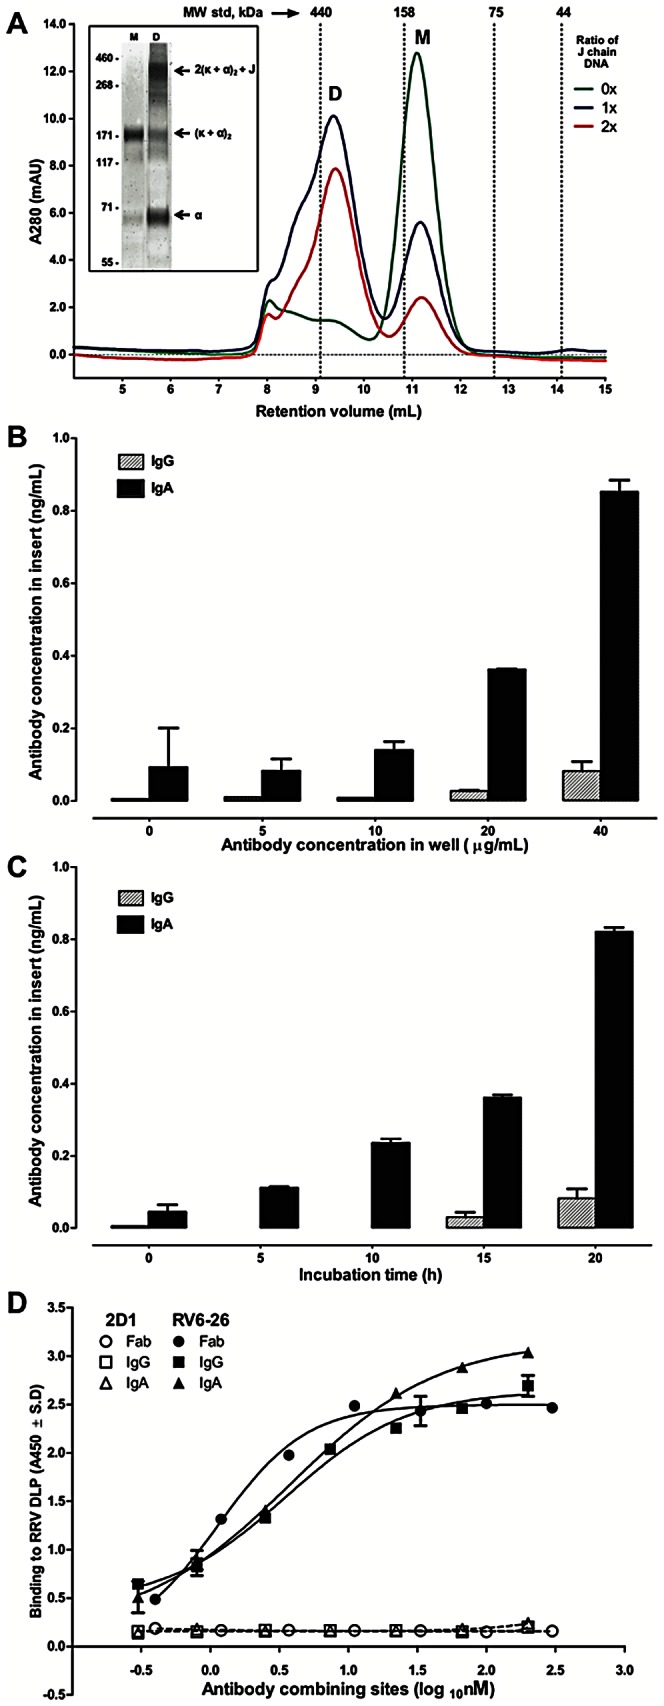
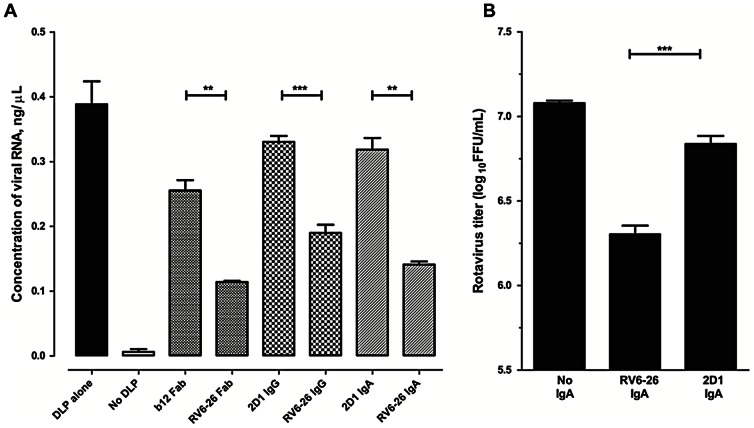
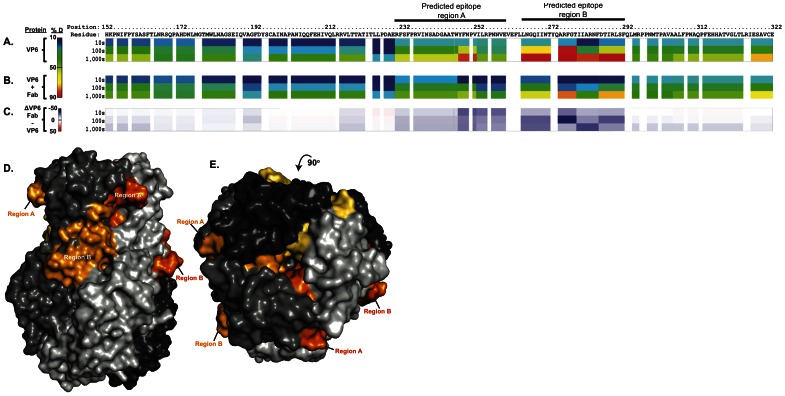
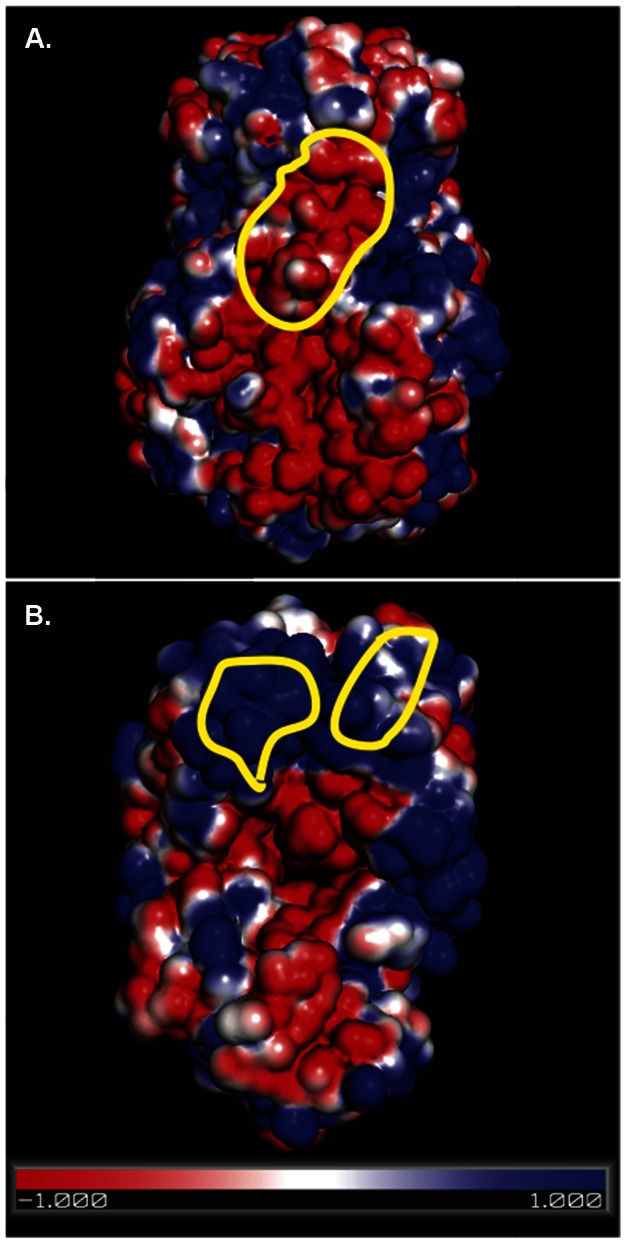
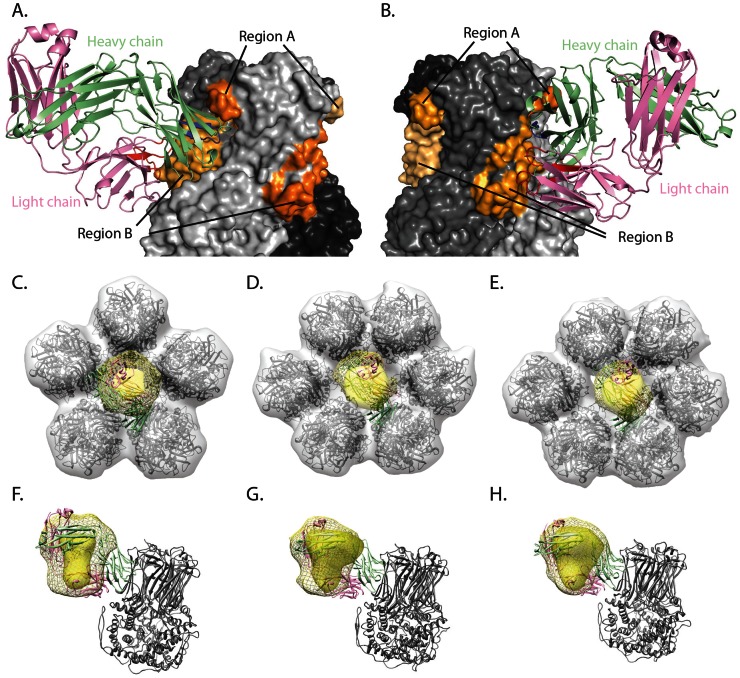
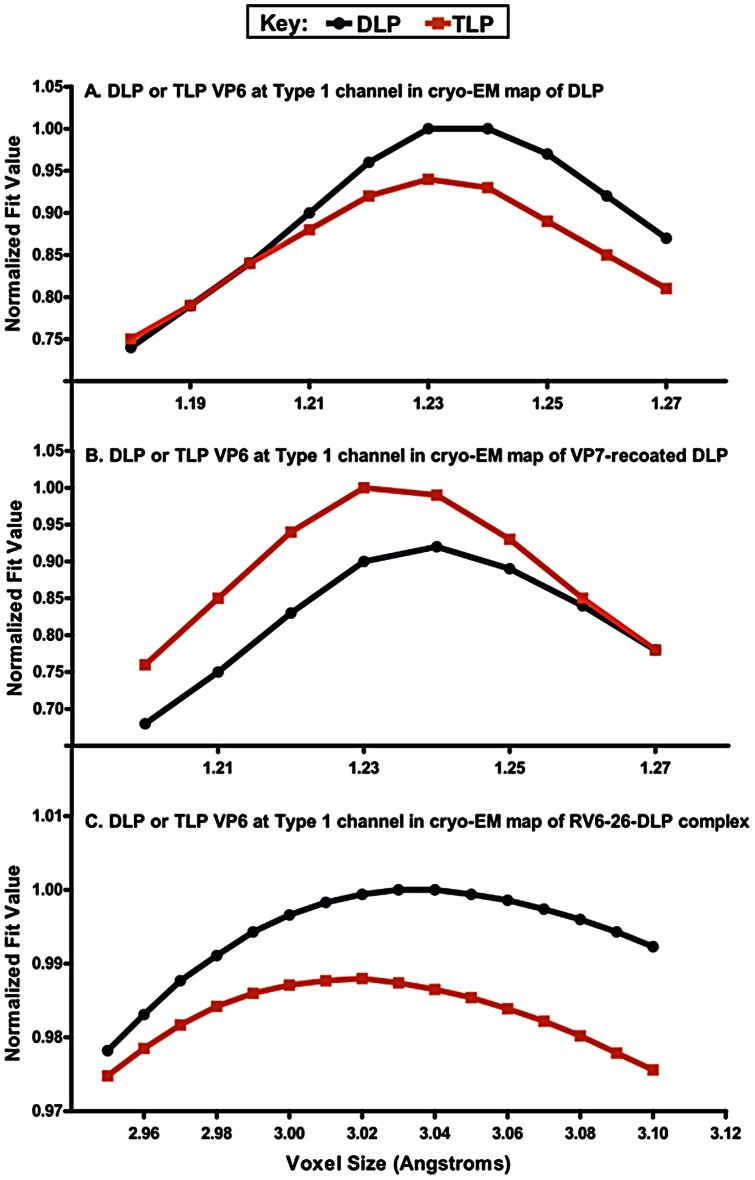
Several live attenuated rotavirus (RV) vaccines have been licensed, but the mechanisms of protective immunity are still poorly understood. The most frequent human B cell response is directed to the internal protein VP6 on the surface of double-layered particles, which is normally exposed only in the intracellular environment. Here, we show that the canonical VP6 antibodies secreted by humans bind to such particles and inhibit viral transcription. Polymeric IgA RV antibodies mediated an inhibitory effect against virus replication inside cells during IgA transcytosis. We defined the recognition site on VP6 as a quaternary epitope containing a high density of charged residues. RV human mAbs appear to bind to a negatively-charged patch on the surface of the Type I channel in the transcriptionally active particle, and they sterically block the channel. This unique mucosal mechanism of viral neutralization, which is not apparent from conventional immunoassays, may contribute significantly to human immunity to RV.


Conflict of interest statement

Competing Interests: The authors have declared that no competing interests exist.

Figures

Figure 1
Figure 1. Recombinant IgA expression, assembly and function.
(A) Transient expression of dimeric IgA was done in 293F cells using a mixture of α, κ and varying amounts of J chain plasmid DNA. Antibody purified from the culture supernatant was fractionated on a Superdex 200 column to monitor the assembly and the different traces represent the amounts of J chain DNA used in transfection (green – 0; blue – 1 and red – 2 times (0×, 1×, or 2×) the amount of α chain DNA). Molecular weight marker standards, as shown, were used for constructing a standard curve. Peaks indicating dimer (D) or monomer (M) fractions are marked. Inset: SDS-PAGE under non-reducing conditions and immunoblotting of dimer and monomer fractions with anti-α chain antibody. Different molecular species are labeled. These data were obtained as aliquots from different fractions from the size exclusion column, and we used them at the concentrations at which they were obtained. Some differences in the relative amounts of one band to another also can be attributed to consequences of electrophoresis conditions (boiling in the presence of denaturing agent). (B) Dose response of IgG or dimeric IgA transcytosis across a polarized epithelial monolayer was tested by adding antibodies to the bottom compartment at different concentrations and measuring the concentration in the supernatant of Transwell inserts after 22 h incubation. (C) Time-course of IgA transcytosis was measured similarly by adding 40 µg/mL antibodies in the bottom compartment and collecting the supernatant in Transwell inserts at indicated time points. (D) RRV DLP were coated on microplates and differing concentrations of Fab, IgG or IgA forms of RV6-26 or 2D1 control human antibody (specific for the HA protein of 1918 influenza) normalized for binding sites (Fab = 1; IgG = 2 and IgA = 4) were allowed to bind to DLP. Bound antibodies were detected using peroxidase-conjugated anti-human κ chain antibodies, and the absorbance values are shown.
Figure 2
Figure 2. Anti-rotaviral activity of RV6-26.
(A) Inhibition of in vitro transcription: EDTA-activated DLP were incubated with 200 nM combining sites of different antibodies and mRNA was synthesized in vitro using selected components of the Riboprobe SP6 system (transcription was mediated by the viral RNA-dependent RNA polymerase not the SP6 DNA-dependent RNA polymerase). First-strand cDNA was synthesized by reverse transcription using a VP6-specific primer. Amplification of cDNA with VP6-specific primers was monitored in a real-time PCR using SYBR Green; the concentrations of RNA estimated from a standard curve constructed using reference RNA extracted from RRV are plotted. (B) Inhibition of rotavirus replication by IgA: polarized monolayers of Caco-2 cells grown on Transwell inserts were treated with polymeric IgA in the basal compartment and inoculated apically with trypsin-activated RRV (MOI = 5) at ambient temperature for 1 h and then cultured for 16 in medium containing trypsin. Amount of rotavirus in the inserts was titrated by inoculating MA104 cells and culturing for 16 h, followed by acetone-fixation and staining with anti-rotavirus polyclonal antibodies conjugated to either Alexa568 or IRDye 800. Detection was done either by scanning on Licor or by counting fluorescent foci.
Figure 3
Figure 3. Structure of RV6-26 Fab bound to RV-DLP.
(A) A representative cryo-micrograph of RV6-26-DLP complexes vitrified in ice over a hole in Quantifoil holey carbon grids. The white boxes indicate complexed particles that were extracted and processed. The inset shows a representative cryo-micrograph of unbound RV-DLP. (B) Surface representation of the resulting 3D structure of RV6-26-DLP complex reconstructed to a 10.9 Å resolution. RV6-26 Fab (yellow) at five-fold axis is indicated by red pentagon (also shown in [C]) Red arrows indicate the location of additional five-fold axes on the structure. The Fabs bound in the pseudo-six-fold axes directly adjacent to the transcriptional pores (blue hexagon [D]) exhibit a different average density representation from those bound at the pseudo-six-fold axes not directly adjacent to the transcriptional pore (brown hexagon [E]).
Figure 4
Figure 4. Determination of VP6 epitope for RV6-26 by deuterium exchange mass spectroscopy.
Ribbon map showing percent deuterated (% D) of VP6 alone (A), or VP6 bound to RV6-26 Fab (B). The top row shows the residue position number, the second row shows the residue and the rest of the rows show protein dynamic features at different on-exchange time points (10, 100, or 1,000 seconds [s]). As indicated in the colored bar, cold colors suggest relatively stable regions and warm colors suggest relatively flexible regions. All prolines are shown in white because prolines do not have amide hydrogens. Residues uncovered by surface deuteration are also shown in white. (C) Difference map showing the influence of RV6-26 Fab binding to VP6 indicated by changes in % D. Blue suggests the regions that exchange slower upon Fab binding; red suggests the regions that exchange faster upon Fab binding. (D) Side view of the predicted epitope regions of RV6-26 Fab on the VP6 structure (PDB-ID 1QHD). The different shades of gray represent the three protomers that make up the VP6 trimer, and the different shades of orange represent the predicted epitope regions A and B mapped on each protomer. Region A on one protomer and region B on a different protomer are visible. (E) The top view of the VP6 trimer with all the predicted epitope regions visible on the structure.
Figure 5
Figure 5. Electrostatic analysis of the binding surfaces involved in interaction between RV6-26 Fab and VP6.
The surface electrostatic potential of the VP6 trimer (A), lateral view, or the RV6-26 Fab (B), with red or blue for negative or positive charges, respectively. The yellow circles indicate region B of the VP6 epitope (A) and the heavy and light chain elements of the paratope on Fab RV6-26 (B), as defined by DXMS analysis. See also Figure S2 in File S1 for RV6-26 paratope, as determined by DXMS.
Figure 6
Figure 6. Computer-generated model of VP6-RV6-26 conformation and comparison to predicted epitope regions and cryo-EM density maps.
The model was generated with RosettaDock, using DXMS-predicted epitope and paratope regions as restraints during docking. (A) RV6-26 bound to VP6 at a quaternary epitope made up of region A on one VP6 protomer and region B of a second VP6 protomer. Shades of gray represent the three protomers that make up the VP6 trimer, and the shades of orange represent the DXMS-predicted epitope regions mapped on each protomer. Heavy and light chains are green and violet, respectively. DXMS-predicted paratope regions for heavy and light chain are colored blue and red, respectively. (B) Horizontal rotation of frame A. (C–E) Fit of representative model into experimental and simulated cryo-EM density of Type I, II, & III channels, respectively. Density attributed to Fab is yellow with simulated Fab density shown as mesh. Experimental VP6 density is gray (simulated density not shown). Cryo-EM density is overlaid on VP6 crystal structure (PDB-ID 3KZ4). Fab interacting with a single VP6 trimer is displayed as cartoon with light chain colored pink and heavy chain colored green. (F–H) Side view of experimental and simulated Fab density for Type I, II, and III channels, respectively, with coloring as in frame C–E.
Figure 7
Figure 7. Docking of coordinates for a ring of five VP6 trimers at the Type I channel into cryoEM maps of DLP, VP7 recoated DLP, and the RV6-26-DLP complex.
(A) Coordinates for a ring of five VP6 trimers, extracted from the crystal structures of the rotavirus DLP (PDB-ID 3KZ4, blue) and the infectious rotavirus particle (PDB-ID 3N09, orange), docked into a segment of the DLP cryoEM structure (EM Data Bank EMD-1460). (B) Same coordinates docked into a segment of the VP7 recoated DLP cryoEM structure (EM Data Bank EMD-1571). (C) Same coordinates docked into a segment of the RV6-26-DLP complex cryoEM structure. The voxel sizes of the cryoEM density maps (1.21 Å/voxel for DLP and VP7 recoated DLP; 3.02 Å/voxel) were varied plus or minus a few percent to find maximum fit values. Fit values were reported by the UCSF Chimera Fit-In-Map function (Chimera, version 1.5.3) and are shown normalized in each panel.

References

    1. Estes MK (2001) Rotavirus and their replication. In: Knipe DM, Howley PM, editors. Fields Virology. Philadelphia, PA: Lippincott Williams and Wilkins. pp. 1747–1785.
    1. Kapikian A (2001) A rotavirus vaccine for prevention of severe diarrhoea of infants and young children: development, utilization and withdrawal. Novartis Found Symp 238: 153–171 (Discussion, 238:171–179.). - PubMed
    1. Yeager M, Dryden KA, Olson NH, Greenberg HB, Baker TS (1990) Three-dimensional structure of rhesus rotavirus by cryoelectron microscopy and image reconstruction. J Cell Biol 110: 2133–2144. - PMC - PubMed
    1. Prasad BVV, Rothnagel R, Zeng CQY, Jakana J, Lawton JA, et al. (1996) Visualization of ordered genomic RNA and localization of transcriptional complexes in rotavirus. Nature 382: 471–473. - PubMed
    1. Estes MK, Kapikian AZ (2007) Rotaviruses. In: Knipe DM, Howley PM, editors. Fields Virology. Philadelphia, PA: Lippincott Williams and Wilkins. pp. 1918–1974.

Publication types

MeSH terms