. 2013 May 6;8(5):e63139.
doi: 10.1371/journal.pone.0063139. Print 2013.

Analyses of the stability and core taxonomic memberships of the human microbiome

Affiliations

Analyses of the stability and core taxonomic memberships of the human microbiome

Kelvin Li et al. PLoS One. .

Abstract

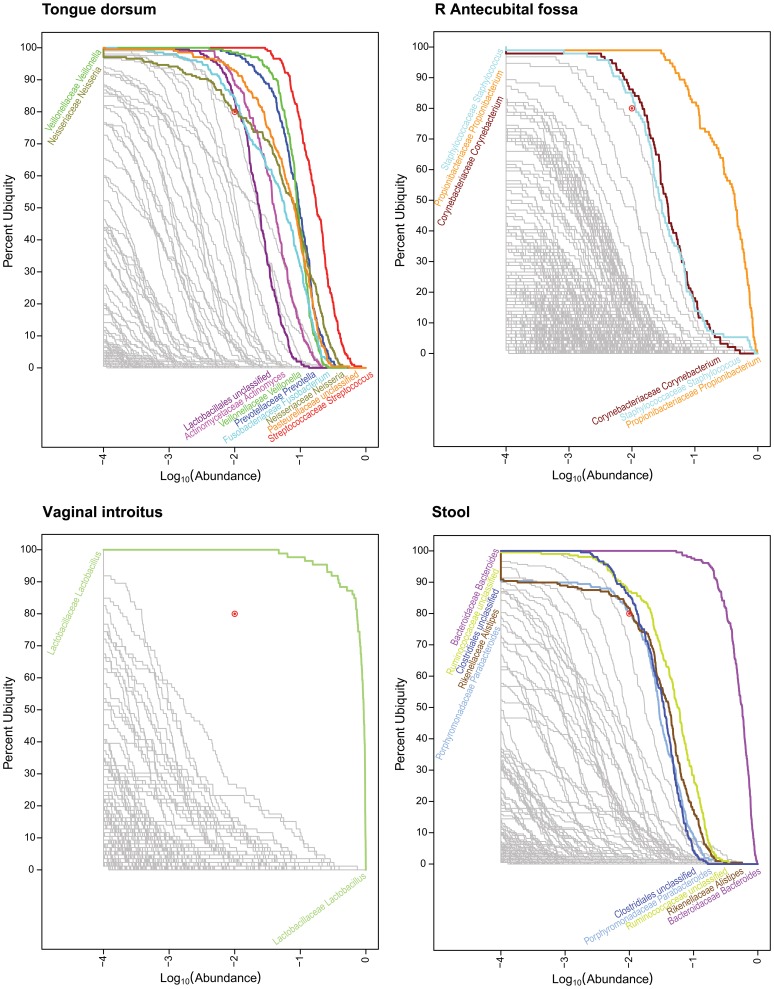
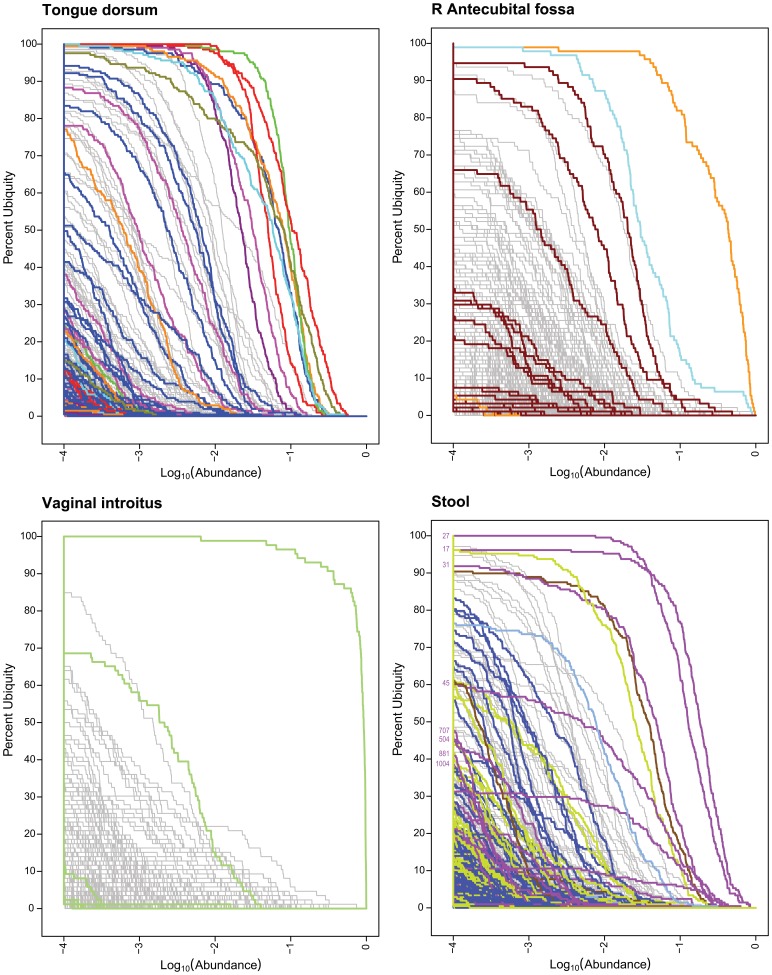
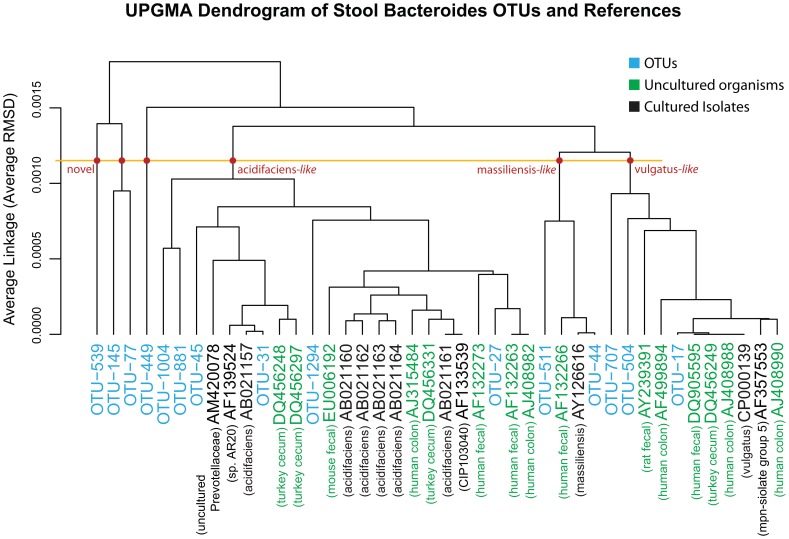
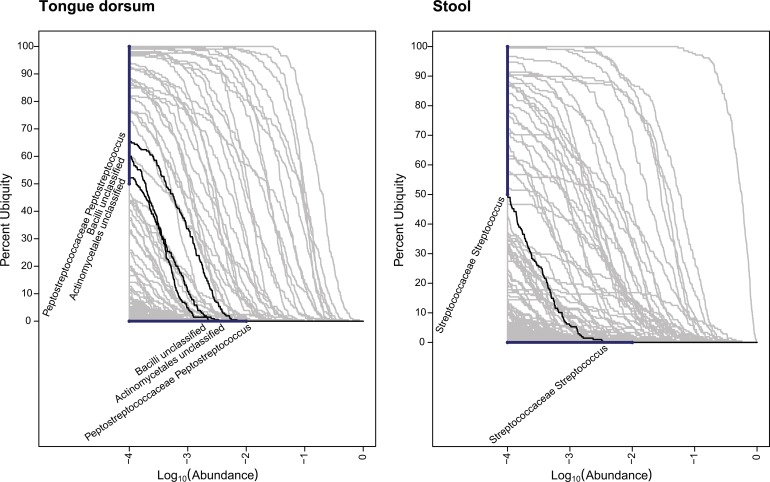
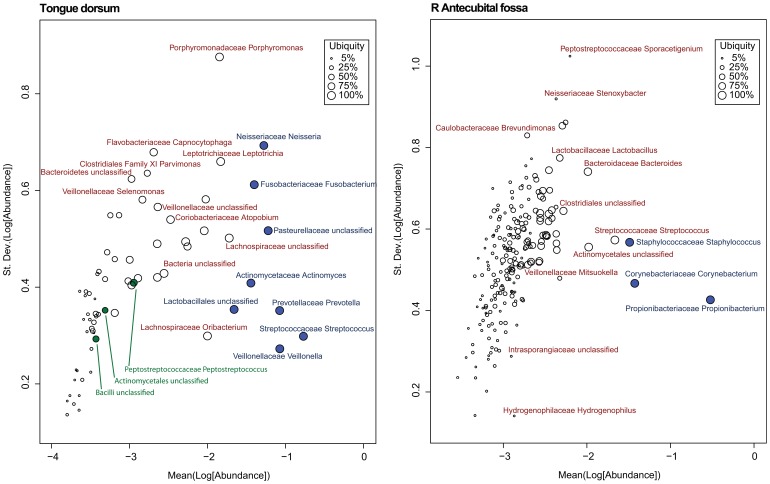
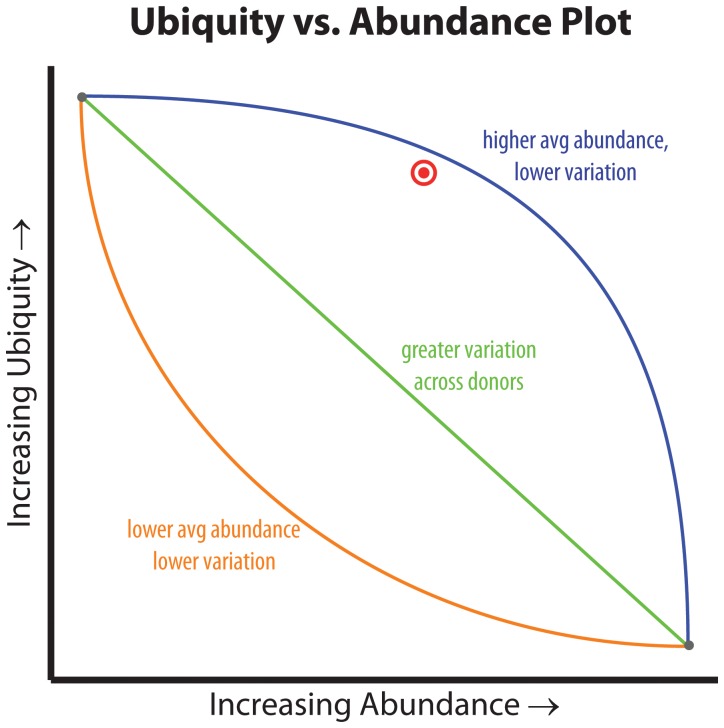
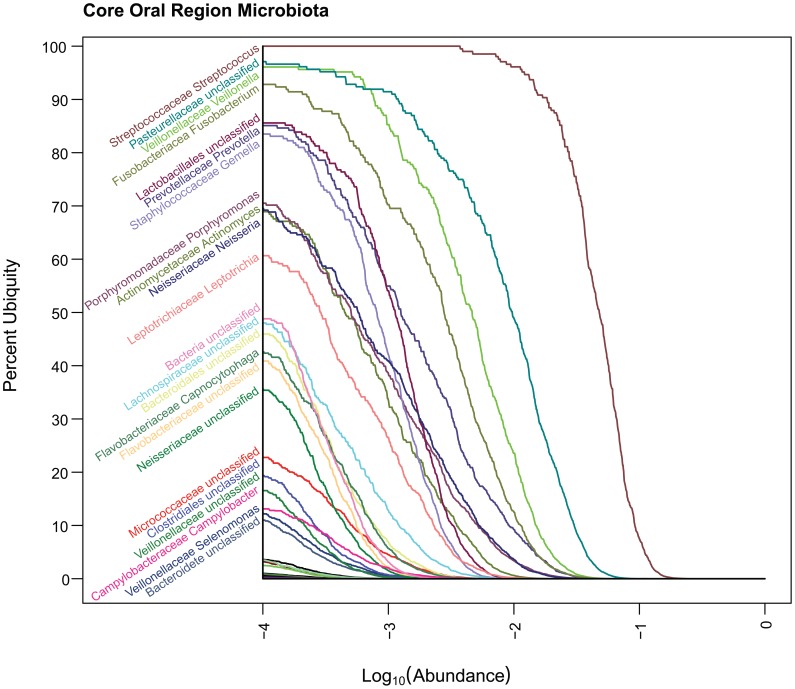
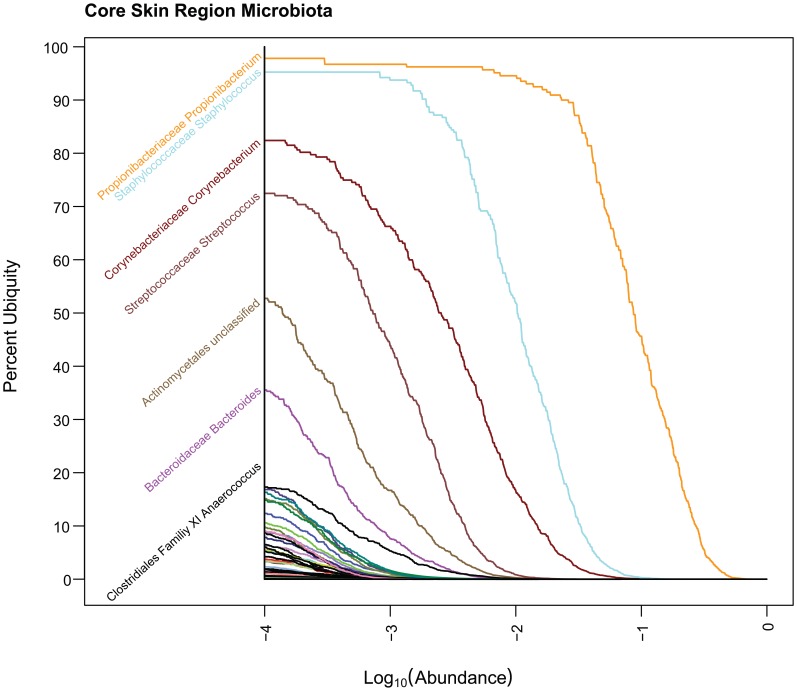
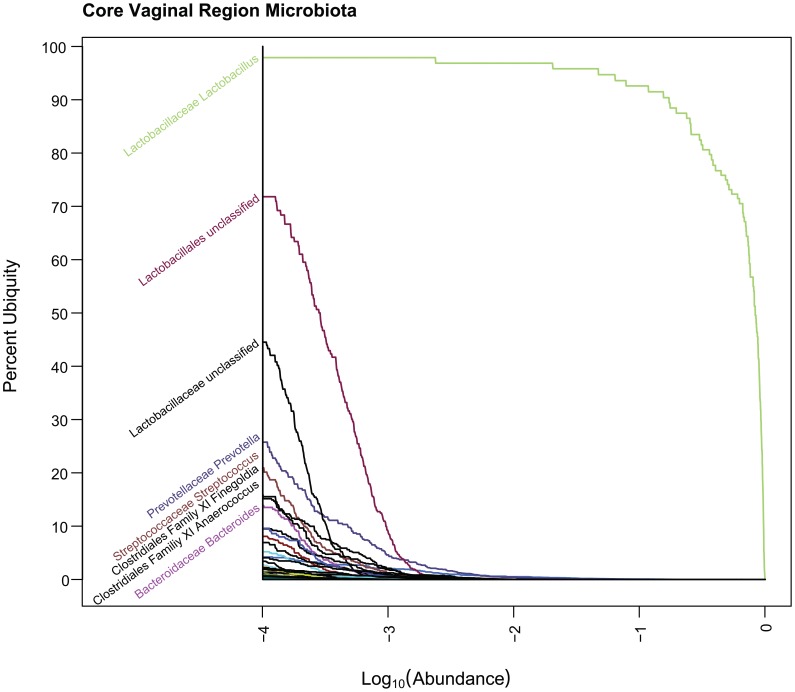
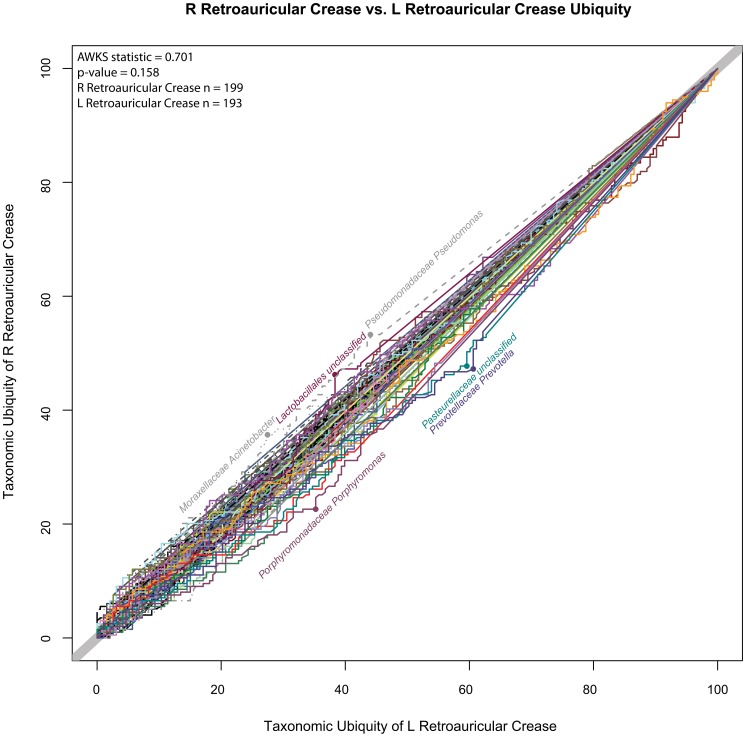
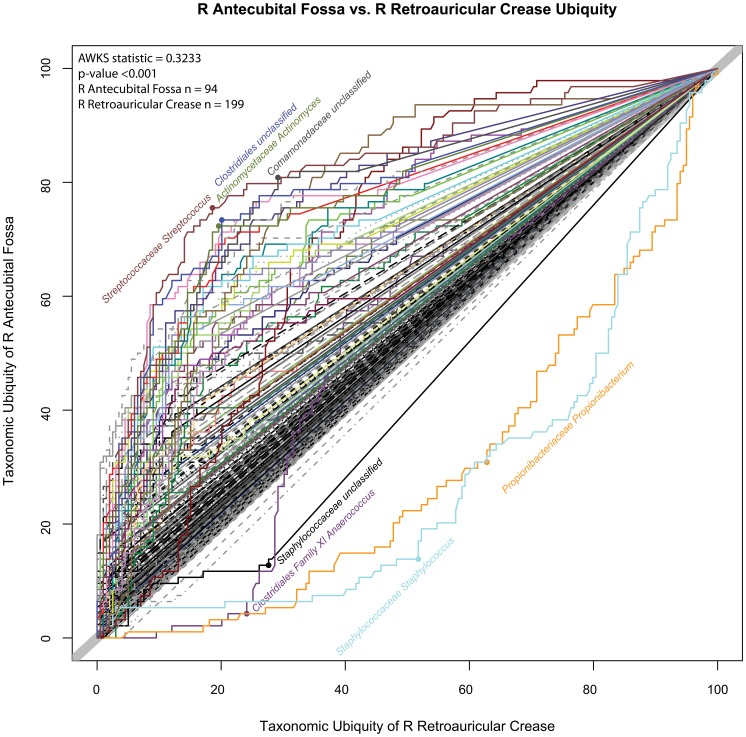
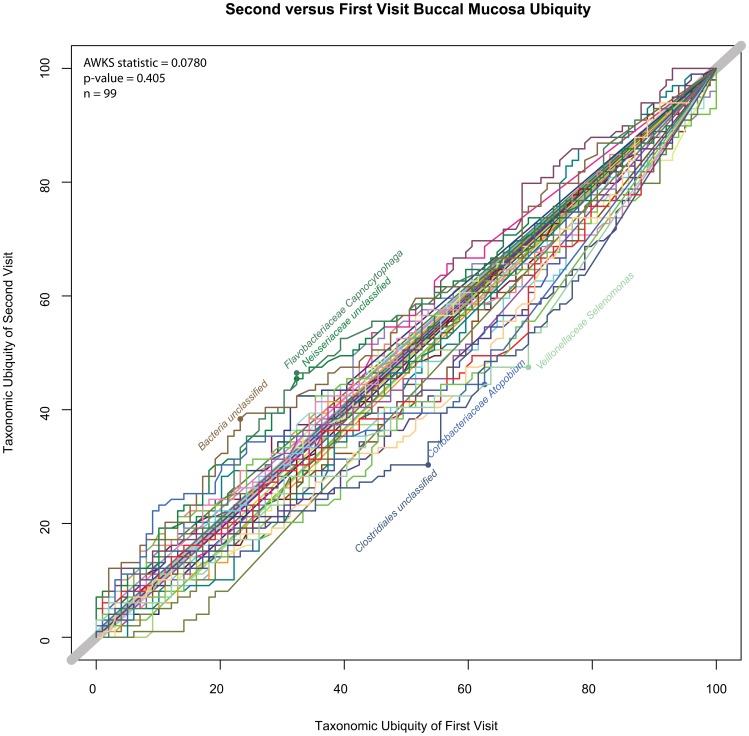
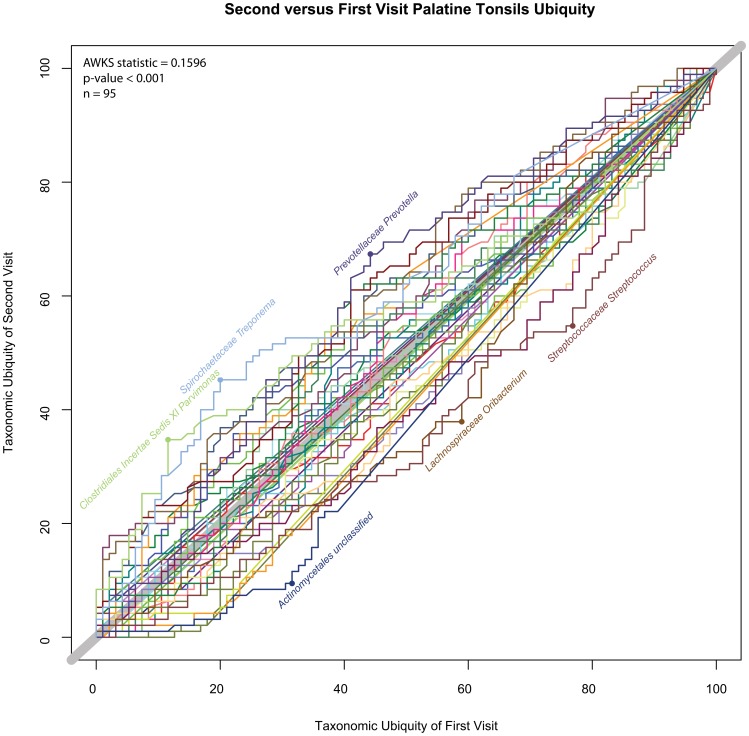
Analyses of the taxonomic diversity associated with the human microbiome continue to be an area of great importance. The study of the nature and extent of the commonly shared taxa ("core"), versus those less prevalent, establishes a baseline for comparing healthy and diseased groups by quantifying the variation among people, across body habitats and over time. The National Institutes of Health (NIH) sponsored Human Microbiome Project (HMP) has provided an unprecedented opportunity to examine and better define what constitutes the taxonomic core within and across body habitats and individuals through pyrosequencing-based profiling of 16S rRNA gene sequences from oral, skin, distal gut (stool), and vaginal body habitats from over 200 healthy individuals. A two-parameter model is introduced to quantitatively identify the core taxonomic members of each body habitat's microbiota across the healthy cohort. Using only cutoffs for taxonomic ubiquity and abundance, core taxonomic members were identified for each of the 18 body habitats and also for the 4 higher-level body regions. Although many microbes were shared at low abundance, they exhibited a relatively continuous spread in both their abundance and ubiquity, as opposed to a more discretized separation. The numbers of core taxa members in the body regions are comparatively small and stable, reflecting the relatively high, but conserved, interpersonal variability within the cohort. Core sizes increased across the body regions in the order of: vagina, skin, stool, and oral cavity. A number of "minor" oral taxonomic core were also identified by their majority presence across the cohort, but with relatively low and stable abundances. A method for quantifying the difference between two cohorts was introduced and applied to samples collected on a second visit, revealing that over time, the oral, skin, and stool body regions tended to be more transient in their taxonomic structure than the vaginal body region.


Conflict of interest statement

Competing Interests: The authors have declared that no competing interests exist.

Figures

Figure 1
Figure 1. Genera Ub-Ab Plots for 4 Body Habitats.
The taxonomic abundance is represented along the x-axis and the ubiquity across the cohort is represented along the y-axis. Abundance and ubiquity increase away from the origin on the bottom left. Based on the sequencing depth of the samples, a cutoff of 1 part per 10,000, or log10(0.0001) = −4 was selected as the plotted lower limit, found on the left-hand side of each Ub-Ab plot. For each plot, the location of the two-parameter cutoff is marked with a red bull’s eye (). Taxa with curves above the bull’s eye are colored and labeled; however those below since they are very numerous and overlapping, are greyed out and left unlabeled to reduce clutter.
Figure 2
Figure 2. OTU Ub-Ab Plots for 4 Body Habitats.
These Ub-Ab plots were generated based on OTUs. The colored curves are based on the same colors used for the core genera in Figure 1. Lines with the same color belong to the same genera.
Figure 3
Figure 3. UPGMA Dendrogram of Stool Bacteroides OTUs.
This is a UPGMA (average-linkage) dendrogram based on a distance matrix computed by using ANDES to estimate the RMSD between the nucleotide distributions of two groups of aligned sequences. The OTUs identified in the stool samples are colored blue. The reference sequences are labeled according to their Genbank ID and color-coded: green for the uncultured organisms and black for the cultured isolates. A short description for each reference sequence is labeled below the Genbank ID. A horizontal line was drawn to mark the possible cutoff for the RMSD difference separating species. The three novel branches and the three species-associated branches (acidifaciens-like, massiliensis-like and vulgatus-like) are marked with red dots.
Figure 4
Figure 4. Genera Minor Core for 2 Body Habitats.
In these Ub-Ab plots, heavy bars are drawn vertically on the y-axis from 50% to 100% ubiquity, and horizontally on the log10 transformed x-axis (abundance) from −4 to −2, representing an abundance of <1%. To qualify for greater than 50% ubiquity and less than 1% abundance, the Ub-Ab curve must originate from the range highlighted by the vertical bar and terminate on the range highlighted by the horizontal bar. The identified minor core taxa are identified for the tongue dorsum and stool body habitats.
Figure 5
Figure 5. Variation of Abundance Plot.
In these Var-Ab plots, the abundance is along the x-axis, and the variation is along the y-axis, with both measurements increasing towards the top right of the plot. Each glyph represents a single taxon, and its size is proportional to the ubiquity of the taxon, thus the larger the glyph, the more ubiquitous the taxon is across the cohort. Those taxa that were previously selected as core at 80% ubiquity and 1% abundance have been filled in with blue, and the minor core have been filled in with green. Taxa towards the top of the plot have greater variation than those on the bottom.
Figure 6
Figure 6. Inflection of the Ub-Ab Curve.
The inflection of the Ub-Ab curve describes the distribution of a taxon’s abundance across the cohort. The blue curve (high abundance core) describes a taxon for a cohort with greater average abundance. Since the majority of the cohort had the taxon assayed at a large abundance, the variance will also be lower. The orange curve (minor core) describes a taxon across a cohort assayed with a majority of low abundant measurements. An average of these abundances will yield a smaller value, and because the taxon abundances are concentrated in the low abundance range, the variance will also be lower. The green line represents a taxa assayed with an even distribution of both high and low abundance, thus its variance will be greater than both taxa represented by the blue and orange curves.
Figure 7
Figure 7. Core Oral Ub-Ab Plot.
The Ub-Ab plot for the oral body region was constructed by multiplying the ubiquities together for each of the 9 oral habitats along all the abundances. At an abundance of 10−4, Streptococcus, Pasteurellaceae (Family), Veillonella and Fusobacterium were found in over 90% of the cohort.
Figure 8
Figure 8. Core Skin Ub-Ab Plot.
The Ub-Ab plot for the skin body region was constructed by multiplying the ubiquities together for each of the 5 skin habitats along all the abundances. At an abundance of 10−4, Propionibacterium and Staphylococcus was found in over 90% of the cohort.
Figure 9
Figure 9. Core Vaginal Ub-Ab Plot.
The Ub-Ab plot for the vaginal body region was constructed by multiplying the ubiquities together for each of the 3 vaginal habitats along all the abundances. At an abundance of 10−4, only Lactobacillus was found in over 90% of the cohort.
Figure 10
Figure 10. L vs. R Retroauricular Crease U-U Plot.
This U-U plot represents the taxonomic differences between the L and R retroauricular crease samples collected from the cohort. The taxonomic ubiquity of the L and R retroauricular crease is represented along the x-axis and y-axis, respectively. If a U-U curve falls along the diagonal line with a slope of 1, then there is no difference between the ubiquities across the abundances for that taxon. The more significant the differences between the ubiquities of a taxon, the further off the diagonal its U-U curve will deviate. The most saliently deviating U-U curves are labeled. The p-value (0.158) for the AWKS statistic computed between the symmetric body habits indicate that there was not a statistically significant (α = 0.05) difference between the microbial communities of the two symmetric body habitats.
Figure 11
Figure 11. R Retroauricular Crease vs.R Antecubital Fossa U-U Plot.
This U-U plot represents the taxonomic differences between the two skin body habitats of R retroauricular crease and R antecubital fossa. The ubiquity of taxa for R retroauricular crease and R antecubital fossa are represented along the x-axis and y-axis, respectively. Taxonomic shifts toward the R antecubital fossa are represented by curves above the diagonal reference line. This plot reveals the greater taxonomic presence of Staphylococcus, Propionibacterium, Anaerococcus, and Staphylococcaceae (family) in the R retroauricular crease. The labeled points represent where the greatest difference of ubiquities are found. For example, at matching abundances, the maximum difference in ubiquity for Streptococcus was found at 76% of the cohort in R antecubital fossa, but only at 19% of the cohort in R retroauricular crease.
Figure 12
Figure 12. Buccal Mucosa, Second vs. First Visit U-U Plot.
This U-U plot represents the comparison between the first and second visits for the buccal mucosa body habitat. There was not a statistically significant different between the two visits (p-value = 0.405, α = 0.05).
Figure 13
Figure 13. Palatine Tonsils, Second vs.First Visit U-U Plot.
This U-U plot represents the comparison between the first and second visits for the palatine tonsils body habitat. There was a statistically significant difference between the two visits (p-value <0.001, α = 0.05).

References

    1. Costello EK, Lauber CL, Hamady M, Fierer N, Gordon JI, et al. (2009) Bacterial community variation in human body habitats across space and time. Science 326: 1694–1697. - PMC - PubMed
    1. Huse SM, Ye Y, Zhou Y, Fodor AA (2012) A Core human microbiome as viewed through 16S rRNA sequence clusters. PloS One 7: e34242. - PMC - PubMed
    1. Ravel J, Gajer P, Abdo Z, Schneider GM, Koenig SS, et al. (2011) Vaginal microbiome of reproductive-age women. Proceedings of the National Academy of Sciences 108 (Supplement 1)4680–4687. - PMC - PubMed
    1. Horner-Devine MC, Lage M, Hughes JB, Bohannan BJM (2004) A taxa-area relationship for bacteria. Nature 432: 750–753 doi: 10.1038/nature03073. - DOI - PubMed
    1. Prosser JI, Bohannan BJ, Curtis TP, Ellis RJ, Firestone MK, et al. (2007) The role of ecological theory in microbial ecology. Nature Reviews Microbiology 5: 384–392. - PubMed

Publication types

LinkOut - more resources