

In vitro development and characterization of a tissue-engineered conduit resembling esophageal wall using human and pig skeletal myoblast, oral epithelial cells, and biologic scaffolds
- PMID: 23672649
- PMCID: PMC3761407
- DOI: 10.1089/ten.TEA.2012.0565
In vitro development and characterization of a tissue-engineered conduit resembling esophageal wall using human and pig skeletal myoblast, oral epithelial cells, and biologic scaffolds
Abstract
Introduction: Tissue engineering represents a promising approach for esophageal replacement, considering the complexity and drawbacks of conventional techniques.
Aim: To create the components necessary to reconstruct in vitro or in vivo an esophageal wall, we analyzed the feasibility and the optimal conditions of human and pig skeletal myoblast (HSM and PSM) and porcine oral epithelial cell (OEC) culture on biologic scaffolds.
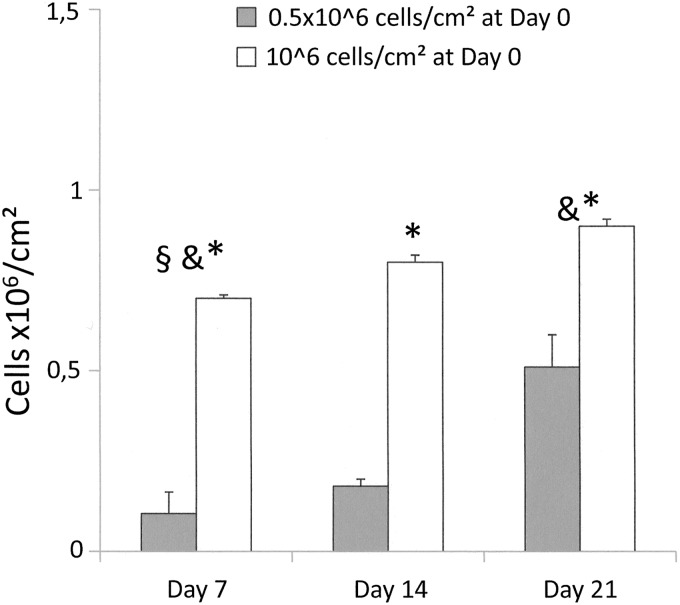
Materials and methods: PSM and HSM were isolated from striated muscle and porcine OECs were extracted from oral mucosa biopsies. Myoblasts were seeded on an acellular scaffold issue from porcine small intestinal submucosa (SIS) and OEC on decellularized human amniotic membrane (HAM). Seeding conditions (cell concentrations [0.5×10(6) versus 10(6) cells/cm(2)] and culture periods [7, 14 and 21 days]), were analyzed using the methyl thiazoltetrazolium assay, quantitative PCR, flow cytometry, and immunohistochemistry.
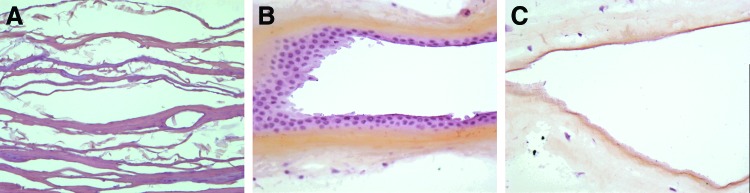
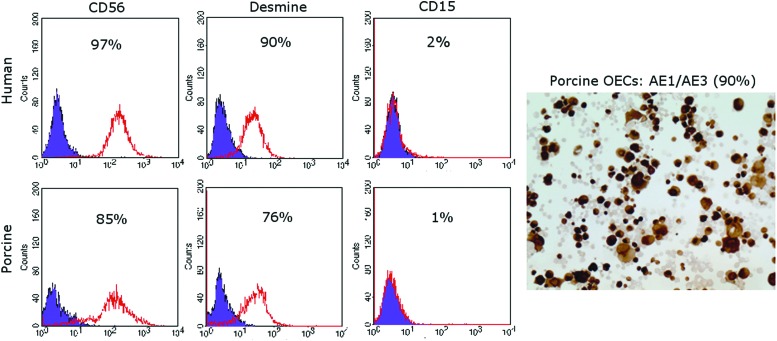
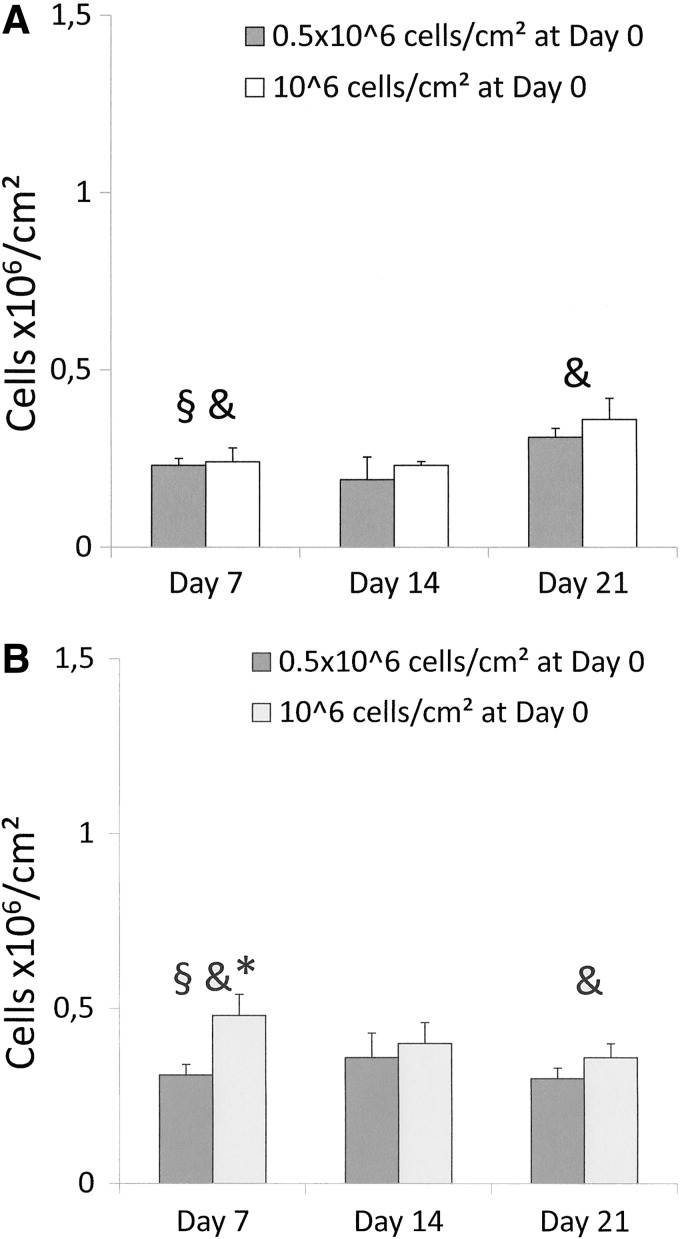
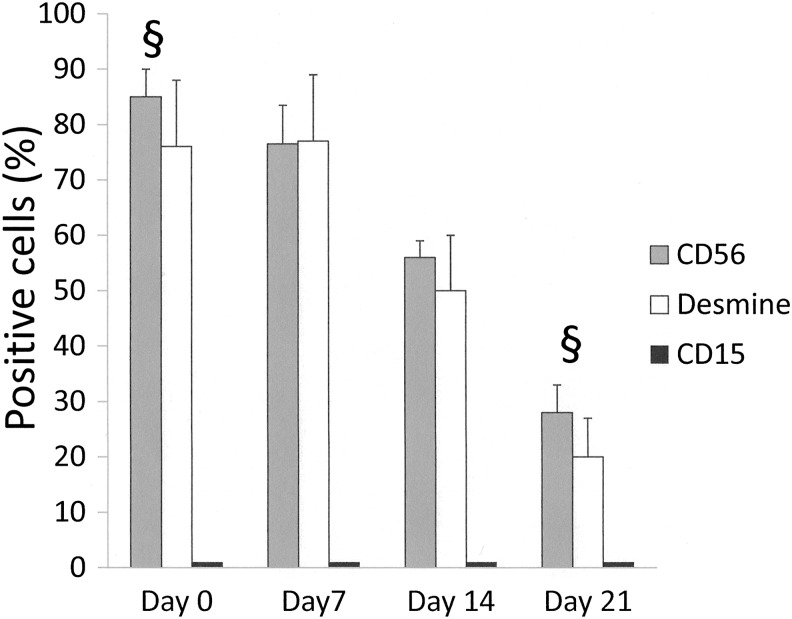
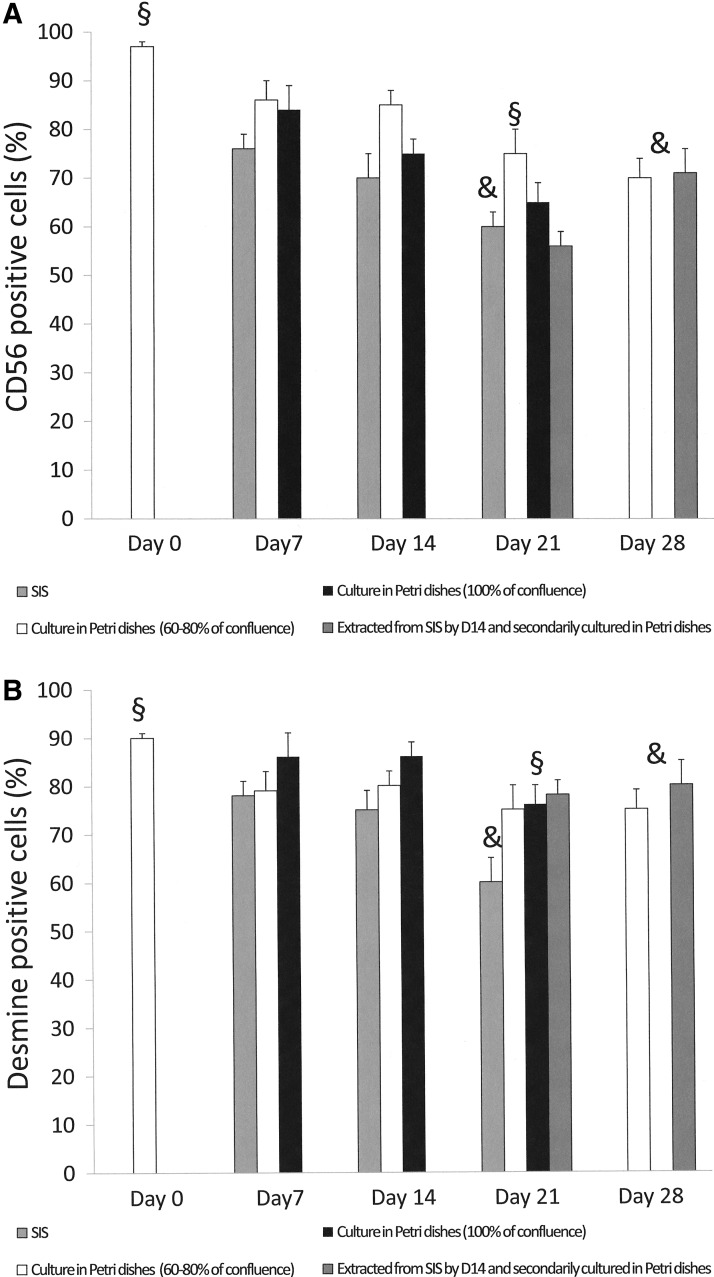
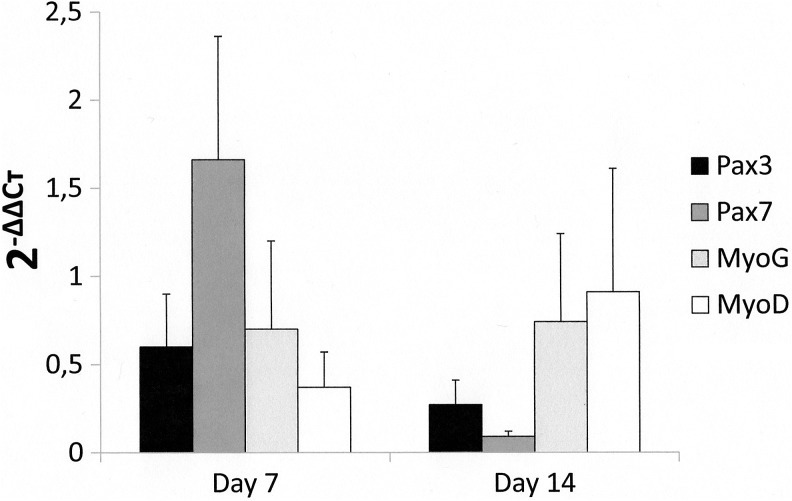
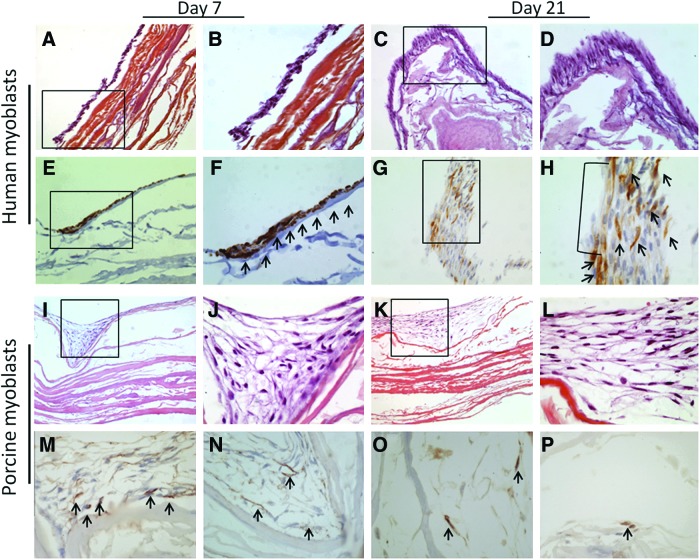
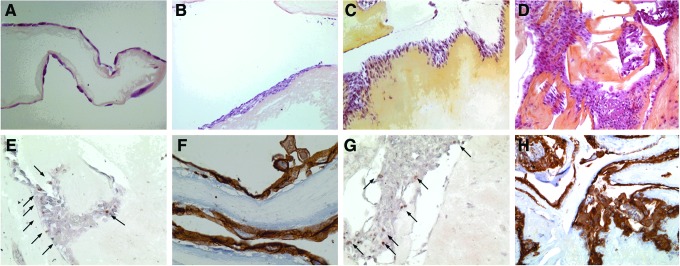
Results: Phenotypic stability was observed after cellular expansion for PSM and HSM (85% and 97% CD56-positive cells, respectively), and OECs (90% AE1/AE3- positive cells). After PSM and HSM seeding, quantities of viable cells were similar whatever the initial cell concentration used and remained stable at all time points. During cell culture on SIS, a decrease of CD56-positive cells was observed (76% and 76% by D7, 56% and 70% by D14, 28% and 60% by D21, for PSM and HSM, respectively). Multilayered surface of α-actin smooth muscle and Desmine-positive cells organized in bundles was seen as soon as D7, with no evidence of cell within the SIS. Myoblasts fusion was observed at D21. Pax3 and Pax7 expression was downregulated and MyoD expression upregulated, at D14.OEC proliferation was observed on HAM with both cell concentrations from D7 to D21. The cell metabolism activity was more important on matrix seeded by 10(6) cells/cm(2). With 0.5×10(6) OEC/cm(2), a single layer of pancytokeratin-positive cells was seen at D7, which became pluristratified by D14, while when 10(6) OEC/cm(2) were used, a pluristratified epithelial structure was seen as soon as D7. Proliferative cells (Proliferating Cell Nuclear Antigen staining) were mainly located at the basal layer.
Conclusion: In this model, the optimal conditions of cell seeding in terms of cell concentration and culture duration were 0.5×10(6) myoblasts/cm(2) and 10(6) OEC/cm(2), and 7 days.
Figures
References
-
- Bothereau H. Munoz-Bongrand N. Lambert B. Montemagno S. Cattan P. Sarfati E. Esophageal reconstruction after caustic injury: is there still a place for right coloplasty? Am J Surg. 2007;193:660. - PubMed
-
- Chirica M. de Chaisemartin C. Munoz-Bongrand N. Halimi B. Celerier M. Cattan P. Sarfati E. Colonic interposition for esophageal replacement after caustic ingestion. J Chir (Paris) 2009;146:240. - PubMed
-
- Chirica M. Veyrie N. Munoz-Bongrand N. Zohar S. Halimi B. Celerier M. Cattan P. Sarfati E. Late morbidity after colon interposition for corrosive esophageal injury: risk factors, management, and outcome. A 20-years experience. Ann Surg. 2010;252:271. - PubMed
-
- Hulscher J.B. van Sandick J.W. de Boer A.G. Wijnhoven B.P. Tijssen J.G. Fockens P. Stalmeier P.F. ten Kate F.J. van Dekken H. Obertop H. Tilanus H.W. van Lanschot J.J. Extended transthoracic resection compared with limited transhiatal resection for adenocarcinoma of the esophagus. N Engl J Med. 2002;347:1662. - PubMed
-
- Seguier-Lipszyc E. Bonnard A. Aizenfisz S. Enezian G. Maintenant J. Aigrain Y. de Lagausie P. The management of long gap esophageal atresia. J Pediatr Surg. 2005;40:1542. - PubMed
Publication types
MeSH terms
LinkOut - more resources
Full Text Sources
Other Literature Sources
Research Materials
Miscellaneous
