. 2013 Aug;132(2):414-25.e6.
doi: 10.1016/j.jaci.2013.03.025. Epub 2013 May 11.

T-cell immunoglobulin and mucin domain 1 deficiency eliminates airway hyperreactivity triggered by the recognition of airway cell death

Affiliations

T-cell immunoglobulin and mucin domain 1 deficiency eliminates airway hyperreactivity triggered by the recognition of airway cell death

Hye Young Kim et al. J Allergy Clin Immunol. 2013 Aug.

Abstract

Background: Studies of asthma have been limited by a poor understanding of how nonallergic environmental exposures, such as air pollution and infection, are translated in the lung into inflammation and wheezing.

Objective: Our goal was to understand the mechanism of nonallergic asthma that leads to airway hyperreactivity (AHR), a cardinal feature of asthma independent of adaptive immunity.

Method: We examined mouse models of experimental asthma in which AHR was induced by respiratory syncytial virus infection or ozone exposure using mice deficient in T-cell immunoglobulin and mucin domain 1 (TIM1/HAVCR1), an important asthma susceptibility gene.

Results: TIM1(-/-) mice did not have airways disease when infected with RSV or when repeatedly exposed to ozone, a major component of air pollution. On the other hand, the TIM1(-/-) mice had allergen-induced experimental asthma, as previously shown. The RSV- and ozone-induced pathways were blocked by treatment with caspase inhibitors, indicating an absolute requirement for programmed cell death and apoptosis. TIM-1-expressing, but not TIM-1-deficient, natural killer T cells responded to apoptotic airway epithelial cells by secreting cytokines, which mediated the development of AHR.

Conclusion: We defined a novel pathway in which TIM-1, a receptor for phosphatidylserine expressed by apoptotic cells, drives the development of asthma by sensing and responding to injured and apoptotic airway epithelial cells.

Keywords: AHR; Airway hyperreactivity; BAL; Bronchoalveolar lavage; NKT; Natural killer T; OVA; Ovalbumin; Phosphatidylserine; PtdSer; RSV; Respiratory syncytial virus; T-cell immunoglobulin and mucin domain; TIM; TIM-1; TUNEL; Terminal deoxynucleotidyl transferase–mediated dUTP nick end labeling; WT; Wild-type; apoptosis; asthma; natural killer T; α-GalCer; α-Galactosylceramide.


Conflict of interest statement

Conflict of interest: The authors have declared that no conflicts of interest exist.

Figures

Figure 1
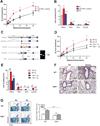
Figure 1. TIM-1 is required for the development of ozone-induced AHR
(A) The strategy for disruption of the TIM-1 gene. Deletion of TIM-1 gene was confirmed by PCR. (B) Results represent changes in lung resistance (RL) in wild type or TIM1−/− mice after air or ozone exposure. *P<0.05, and **P<0.01, compared to air exposed group (Two-way ANOVA). (C) Inflammatory cell numbers in BAL fluid of 1B (cells/lung). *P<0.05, and **P<0.01, compared to air exposed group (Two-tailed t-test). (D) Representative lung sections stained with hematoxylin/eosin (magnification; X10). (E) Percentage of tetramer+TCRβ+ NKT cells in the lung after exposure to either air or ozone (left) and total number of NKT cells (right). ***P<0.001(WT, air vs ozone exposed group) or ***P<0.001 (WT vs TIM1−/− mice after ozone exposure) (Two-tailed t-test). Data are representative of at least three independent experiments with three to five mice per group.
Figure 2
Figure 2. TIM-1 is not required for the development of OVA-induced AHR
(A) WT and TIM1−/− mice develop AHR equivalently after sensitization and challenge with OVA. Graph represents the changes in lung resistance (RL). TIM1−/− OVA group was compared to WT OVA group (Two-way ANOVA). ns, not significant. (B) Inflammatory cell numbers in BAL fluid after OVA challenge (cells/lung). The TIM1−/− OVA group was compared to WT OVA group (not significant, Two-tailed t-test). Mac, macrophage; Neu, neutrophils; Eos, eosinophils; Lymph, lymphocytes. (C) The number of NKT cells was calculated as Fig.1G. Tetramer+TCRβ+ NKT cells after saline or OVA challenge (left), and graphs represent the total number of NKT cells in each group. ***P<0.001(WT), ***P<0.001(TIM1−/−, saline vs OVAgroup), not significant, (WT vs TIM1−/− mice after OVA challenge) (Two-tailed t-test). Data are representative of at least three independent experiments with three to five mice per each group.
Figure 3
Figure 3. Oxidative stress induces apoptosis in the airway
(A) WT mice were exposed to air (top) or ozone (bottom) as in Fig 1, and lungs were taken 24h after last ozone exposure for Immunofluorescence staining. PI (nuclear staining) (red), and TUNEL staining (green). Arrows indicate the apoptotic cells (yellow). Original magnification; X40. Data are representative of two independent experiments with three to four mice in each group. (B) WT or TIM1−/− mice were exposed to air (top) or ozone (bottom) and apoptotic epithelial cells(CD45 cells) were stained with AnnexinV-FITC (left panel). Graph represents the percentage of AnnexinV positive cells in each group. TIM1−/− mice were compared to WT mice, not significant (Two-tailed t-test) (C) WT mice were exposed to air or ozone and anti-TIM1 (3D10) mAb was injected 24 hr before the first ozone exposure. Results represent the changes in lung resistance (RL). *P<0.05, and **P<0.01 compared to air exposed group (Two-way ANOVA). (D) Inflammatory cell numbers in BAL fluid of Fig. 1A (cells/lung). *P<0.05, and **P<0.01 compared to air exposed mice (Two-tailed t-test). Mac, macrophage; Neu, neutrophils; Eos, eosinophils; Lymph, lymphocytes.
Figure 4
Figure 4. Apoptotic cells were critical for the development of ozone induced AHR
(A) Q-VD-OPH (2mg/kg) was injected 24 hr before every ozone exposure, and AHR measured 6 days after first exposure. *P<0.05, compared to air exposed group (Two-way ANOVA). (B) Inflammatory cell numbers in BAL fluid (cells/lung). ** P<0.01, and ***P<0.001, compared to air exposed group (Two-tailed t-test). Macs, macrophage; Neu, neutrophils; Eos, eosinophils; Lymph, lymphocytes. (C) Lung sections from the mice shown in Fig 4A stained with hematoxylin/eosin (magnification;X10). (D) Apoptotic airway epithelial cells (left), and the percentage of AnnexinV positive cells in each group(right). Q-VD-OPH treated mice were compared to ozone exposed mice. *P<0.05 (Two-tailed t-test). Data are representative of two independent experiments with three to five mice.
Figure 5
Figure 5. Apoptotic cells activate NKT cells through TIM-1
(A) Apoptosis of mouse airway epithelial cell line (MLE12) after H2O2 treatment was examined by AnnexinV and PI staining. (B) WT or TIM1−/− NKT cells were cultured with a suboptimal dose of α-GalCer (1ng/ml) (−); an optimal dose of α-GalCer (100 ng/ml); live MLE12 cells + suboptimal α-GalCer (1ng/ml); apoptotic MLE12 + suboptimal α-GalCer (1ng/ml) or apoptotic MLE12 + suboptimal α-GalCer (1ng/ml) + Annexin V (10ug/ml) for 48hr. Data are representative of at least three independent experiments. (C) Human NKT cells were cultured with a suboptimal dose of α-GalCer (1ng/ml) (−); an optimal dose of α-GalCer (100 ng/ml); live A549 cells + suboptimal α-GalCer (1ng/ml); apoptotic A549+ suboptimal α-GalCer (1ng/ml) or apoptotic A549 + suboptimal α-GalCer (1ng/ml) + Annexin V (10ug/ml) for 48hr. NKT cells were then stained for intracellular cytokines. Data are representative of three independent experiments. (D) The percentage of IL-4 producing NKT cells from all three experiments was calculated and graphed.
Figure 6
Figure 6. TIM-1 expression by NKT cells is required for ozone-induced AHR
(A) Schematic diagram of adoptive transfer of WT or TIM1−/− NKT cells. (B) After repeated exposure to ozone, AHR was measured. **P<0.01 compared to ozone treated Jα18−/− mice group (Two-way ANOVA). (C) Inflammatory cells in BAL fluid (cells/lung). Macs, macrophage; Neu, neutrophils; Eos, eosinophils; Lymph, lymphocytes. *P<0.05, and **P<0.01 compared to ozone treated Jα18−/− mice group (Two-tailed t-test). (D) WT or TIM1−/− mice were exposed to ozone as in Fig 1A. Lung cells were prepared and stimulated with PMA and ionomycin for 4hr. Cytokines produced from NKT cells were stained for intracellular IL-4, IL-13 and IL-17. *P<0.05, TIM1−/− mice were compared to ozone treated WT mice (Two-tailed t-test). Data are representative of at least two independent experiments.
Figure 7
Figure 7. RSV infection induces AHR in a TIM-1 dependent manner
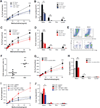
(A) WT or TIM1−/− mice were infected with RSV or sham, and lung resistance (RL) measured on day 6 post infection. *** P<0.001 compared to sham infected group (Two-way ANOVA). (B)BAL fluid was taken from the mice in (A), and assessed for inflammatory cells (cells/lung). Macs, macrophage; Neu, neutrophils; Eos, eosinophils; Lymph, lymphocytes. **P<0.01, WT vs TIM1−/− mice infected with RSV (Two-tailed t-test). (C) WT or CD1d−/− mice were infected with RSV or sham infected, and lung resistance (RL) was measured. *** P<0.001, WT vs CD1d−/− mice infected with RSV (Two-way ANOVA). (D) BAL fluids were assessed for inflammatory cells. Macs, macrophage; Neu, neutrophils; Eos, eosinophils; Lymph, lymphocytes. ** P<0.01, and ***P<0.001, WT RSV infected group was compared to CD1d−/− RSV-infected group (Two-tailed t-test). (E) Tetramer+TCRβ+ NKT cells in BAL fluid after sham (left panels) or RSV (right panels) infection. (F) Graph represents the % of annexinV positive cells. ***P<0.001, compared to sham infected group (Two-tailed t-test). (G) Q-VD-OPH (2mg/kg) was injected before RSV infection, and AHR measured. ***P<0001, compared to RSV infected group (Two-way ANOVA). (H) BAL fluid was taken from the mice in (G), and assessed for inflammatory cells. Macs, macrophage; Neu, neutrophils; Eos, eosinophils; Lymph, lymphocytes. * P<0.05, and **P<0.01, RSV vs RSV + Q-VD-OPH group (Two-tailed t-test). (I) WT or TIM1−/−NKT cells (5 × 10⁵/mouse) were transferred into Jα18−/− recipients before RSV infection, and AHR was measured. **P<0.01 J α18−/− mice with WT NKT cells were compared to Jα18−/− mice with TIM1−/− NKT cells (Two-way ANOVA). (J) BAL fluids were assessed for inflammatory cells. Macs, macrophage; Neu, neutrophils; Eos, eosinophils; Lymph, lymphocytes. * P<0.05, Jα18−/− mice transferred with WT NKT cells were compared to Jα18−/− mice transferred with TIM1−/− NKT cells (Two tailed t-test). Data are representative of at least two independent experiments with four to six mice in each group.
Figure 8
Figure 8. Schematic diagram of the role of TIM-1 in non-allergic forms of asthma
In some forms of asthma (e.g., associated with air pollution and RSV infection), apoptotic airway epithelial cells activate NKT cells via TIM-1 recognition of dead cells, and these in turn activated NKT cells, which induce airway inflammation and AHR.

Similar articles

Cited by

References

    1. Kim HY, DeKruyff RH, Umetsu DT. The many paths to asthma: phenotype shaped by innate and adaptive immunity. Nat Immunol. 2010;11:577–584. - PMC - PubMed
    1. Wenzel SE. Asthma phenotypes: the evolution from clinical to molecular approaches. Nat Med. 2012;18:716–725. - PubMed
    1. Moussion C, Ortega N, Girard JP. The IL-1-like cytokine IL-33 is constitutively expressed in the nucleus of endothelial cells and epithelial cells in vivo: a novel 'alarmin'? PLoS One. 2008;3:e3331. - PMC - PubMed
    1. Henson PM, Tuder RM. Apoptosis in the lung: induction, clearance and detection. Am J Physiol Lung Cell Mol Physiol. 2008;294:L601–L611. - PubMed
    1. Auerbach A, Hernandez ML. The effect of environmental oxidative stress on airway inflammation. Curr Opin Allergy Clin Immunol. 2012;12:133–139. - PMC - PubMed

Publication types

MeSH terms