Review
. 2013 Sep:62:51-7.
doi: 10.1016/j.yjmcc.2013.05.001. Epub 2013 May 12.

The connection between inner membrane topology and mitochondrial function

Affiliations
Review

The connection between inner membrane topology and mitochondrial function

Carmen A Mannella et al. J Mol Cell Cardiol. 2013 Sep.

Abstract

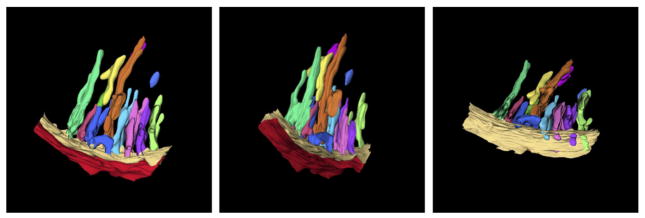
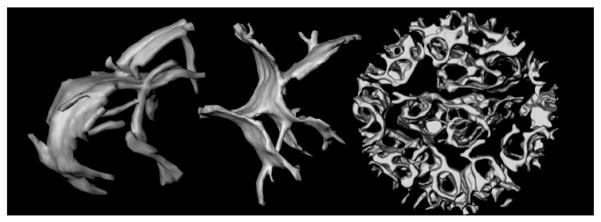
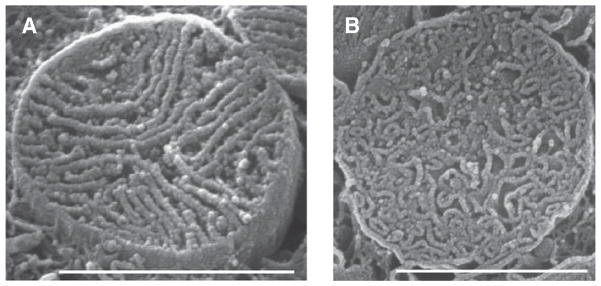
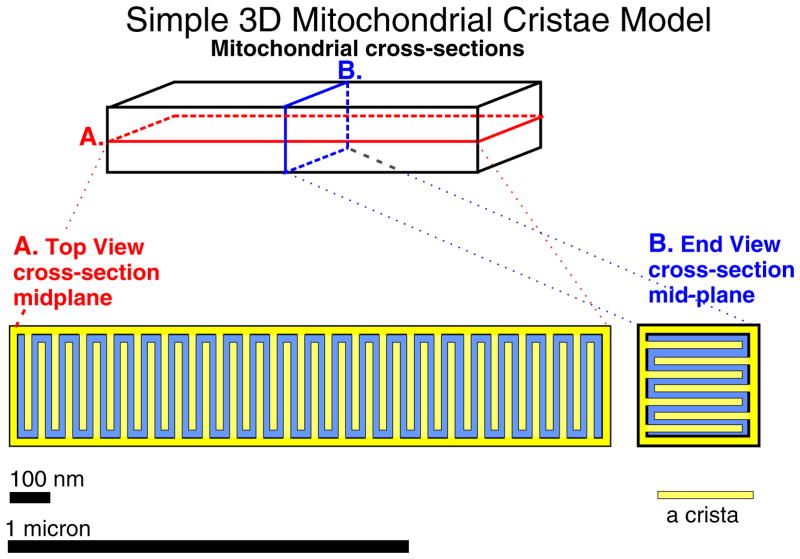
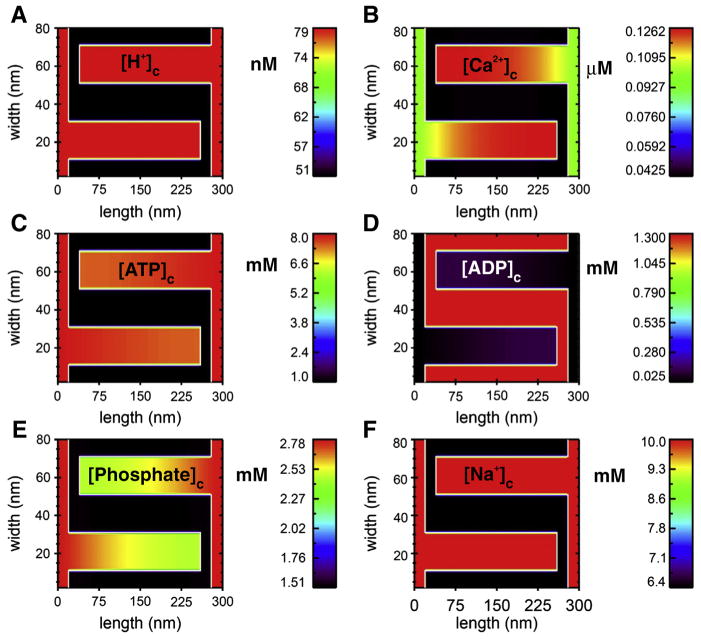
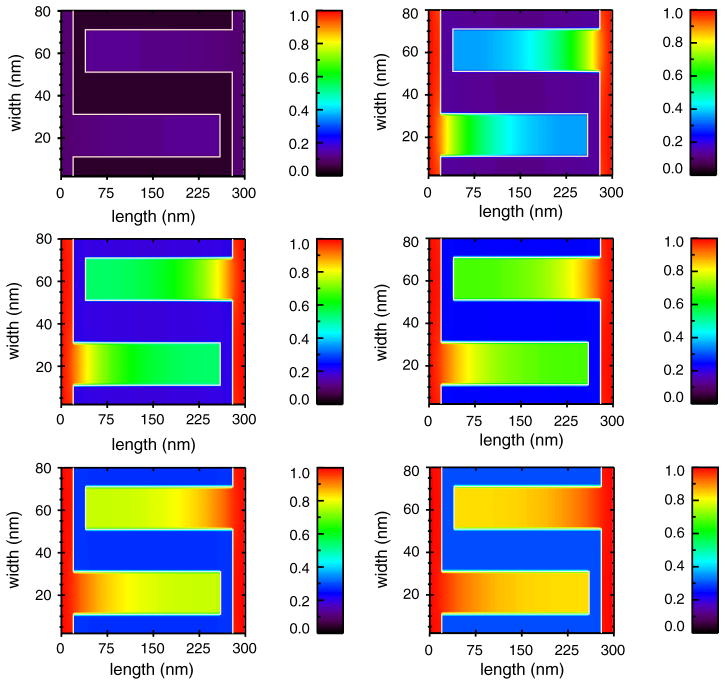
The mitochondrial inner membrane has a complex and dynamic structure that plays an important role in the function of this organelle. The internal compartments called cristae are created by processes that are just beginning to be understood. Crista size and morphology influence the internal diffusion of solutes and the surface area of the inner membrane, which is home to critical membrane proteins including ATP synthase and electron transport chain complexes; metabolite and ion transporters including the adenine nucleotide translocase, the calcium uniporter (MCU), and the sodium/calcium exchanger (NCLX); and many more. Here we provide a brief overview of what is known about crista structure and formation, and discuss mitochondrial function in the context of that structure. We also suggest that mathematical modeling of mitochondria that incorporates accurate information about the organelle's internal architecture can lead to a better understanding of its diverse functions. This article is part of a Special Issue entitled 'Calcium Signalling in Heart'.


Conflict of interest statement

Conflict of interest

None declared.

Figures

Fig. 1
Fig. 1
Three dimensional membrane structure of an avian cardiac muscle mitochondrion, obtained by electron tomography. The pleomorphic nature of the closely packed cristae is evident. The tilted view reveals the narrow openings of the cristae (crista junctions) into the boundary region of the inner membrane. The reconstructed sector of this mitochondrion is ca. 300 nm in length. Used with generous permission from Z. Almsherqi and Y. Deng.
Fig. 2
Fig. 2
Topology of mitochondrial inner membranes. Left and middle: Cristae in intact, frozen-hydrated rat-liver mitochondria. The larger compartments appear to be formed by fusion of tubular membranes. These cristae are ca. 600 nm in length. Right: Inner membrane of a mouse liver mitochondrion after treatment with the pro-apoptotic protein t-Bid [17]. Curvature of the crista membranes is reversed and the intracristal space essentially forms one continuous compartment. The diameter of this mitochondrion is 860 nm. Figure from Mannella (2008), Annals New York Acad Sci [16] reproduced with permission of the publisher (Elsevier).
Fig. 3
Fig. 3
Densely packed cristae in cardiac ventricular myocytes. Scanning EM images of mitochondria cristae from rat ventricular myocytes. A. Lamellar cristae. B. Tubular cristae. Scale bars 1 — μm; cristae width are about 30 nm. Figure from Hoppel et al. (2009) Int J Biochem Cell Biol [42,43], reproduced with permission of the publisher (Elsevier).
Fig. 4
Fig. 4
Simple mitochondrial cristae model in 3D. An intermyofibrillar mitochondrion (IFM) of size 1500 nm × 300 nm × 300 nm. A. Top view, cross-section, mid-plane. B. End view cross-section mid-plane. Each crista in the model is 240 nm long × 20 nm square and separated from other cristae by 20 nm. There are 42 cristae in a 40 nm plane and 7 layers of cristae, for a total of 294 cristae. The surface area per crista is 240 nm × 20 nm × 4 + 20 × 20 nm2 or 1.96 104 nm2. Thus the surface area of the inner membrane is 1.96 104 × 294 or 5.76 106 nm2, which is about three times larger than the surface area of the outer member, 1.98 106 nm2. The matrix is approximately half of the volume contained within the outer membrane. As noted, other shapes of the cristae may occur and will affect mitochondrial function.
Fig. 5
Fig. 5
Diffusion down the length of cristae modeled as a 2D structure. Using a simple two-dimensional transport model (based on the study of Nguyen, Dudycha and Jafri in 2007 [46]) with the mitochondrial geometry of Fig. 4, steady-state crista gradients are shown for 6 solutes in a simulation run to steady state. This model includes the tricarboxylic acid, electron transport chain fluxes, ionic homeostasis (including H+, Ca2+, ATP, ADP, Pi and Na+) and the adenine nucleotide translocase (ANT) among other features [46]. The fluxes are uniformly distributed along the mitochondrial inner membrane (white line in the figure), about 93% of which lies within the cristae in this model (about 78% in the model of Fig. 4). The behavior of these components was modeled after biochemical/biophysical measurements. The maximal fluxes of each of the component were constrained to give appropriate metabolite concentrations, total Krebs cycle fluxes, ATP production, membrane potential, and ionic homeostasis. The outer membrane is assumed to be permeable with respect to the modeled substances and was thus treated as a fixed boundary condition with cytosolic concentrations of metabolites. The sides of the two zoomed-in cristae are treated with periodic boundary conditions to mimic the repeated structures of the mitochondria (see Fig. 4). The images show the steady-state profiles (after 0.5 ms simulation time) of the six solutes under diastolic conditions. A. [H+]c in nM. B. [Ca2+]c in μM. C. [ATP]c in mM. D. [ADP]c in mM. E. [Phosphate]c in mM. F. [Na+]c in mM. Initial conditions: The intermembrane space adjacent to the outer membrane at the ends of the cristae are assumed to have concentrations equal to the cytosol (i.e. the outer membrane is no permeability barrier for these substances).
Fig. 6
Fig. 6
Time-course of cristae [Ca2+] ([Ca2+]c) following a 1 μM elevation of [Ca2+]i from 100 nM. Using the same model as in Fig. 5 the time-course of an increase of [Ca2+]c over 0.5 ms in five 0.1 ms steps. Upper left panel: before (0.0 ms, equal to the steady-state conditions from Fig. 5B); lower right panel: after 0.5 ms the diffusion of [Ca2+]c has come to a new steady-state. An animation of this simulation is provided as a Supplemental Material.

References

    1. Calvo SE, Mootha VK. The mitochondrial proteome and human disease. Annu Rev Genomics Hum Genet. 2010;11:25–44. - PMC - PubMed
    1. Munn EA. The structure of mitochondria. London: Academic Press; 1974.
    1. Hackenbrock CR. Ultrastructural bases for metabolically linked mechanical activity in mitochondria. I. Reversible ultrastructural changes with change in metabolic steady state in isolated liver mitochondria. J Cell Biol. 1966;30:269–97. - PMC - PubMed
    1. Mitchell P. Keilin’s respiratory chain concept and its chemiosmotic consequences. Science. 1979;206:1148–59. - PubMed
    1. Williams RJ. Mitochondria and chloroplasts: localized and delocalized bioenergetic transduction. Trends Biochem Sci. 2000;25:479. - PubMed

Publication types

LinkOut - more resources