Low BRAF and NRAS expression levels are associated with clinical benefit from DTIC therapy and prognosis in metastatic melanoma
- PMID: 23673558
- PMCID: PMC3837233
- DOI: 10.1007/s10585-013-9587-4
Low BRAF and NRAS expression levels are associated with clinical benefit from DTIC therapy and prognosis in metastatic melanoma
Abstract
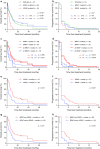
Metastatic melanoma is characterized by a poor response to chemotherapy. Furthermore, there is a lack of established predictive and prognostic markers. In this single institution study, we correlated mutation status and expression levels of BRAF and NRAS to dacarbazine (DTIC) treatment response as well as progression-free and overall survival in a cohort of 85 patients diagnosed with advanced melanoma. Neither BRAF nor NRAS mutation status correlated to treatment response. However, patients with tumors harboring NRAS mutations had a shorter overall survival (p < 0.001) compared to patients with tumors wild-type for NRAS. Patients having a clinical benefit (objective response or stable disease at 3 months) on DTIC therapy had lower BRAF and NRAS expression levels compared to patients progressing on therapy (p = 0.037 and 0.003, respectively). For BRAF expression, this association was stronger among patients with tumors wild-type for BRAF (p = 0.005). Further, low BRAF as well as NRAS expression levels were associated with a longer progression-free survival in the total population (p = 0.004 and <0.001, respectively). Contrasting low NRAS expression levels, which were associated with improved overall survival in the total population (p = 0.01), low BRAF levels were associated with improved overall survival only among patients with tumors wild-type for BRAF (p = 0.013). These findings indicate that BRAF and NRAS expression levels may influence responses to DTIC as well as prognosis in patients with advanced melanoma.
Figures


Similar articles
-
Correlation of BRAF and NRAS mutation status with outcome, site of distant metastasis and response to chemotherapy in metastatic melanoma.Br J Cancer. 2014 Jul 15;111(2):292-9. doi: 10.1038/bjc.2014.287. Epub 2014 Jun 10. Br J Cancer. 2014. PMID: 24918823 Free PMC article.
-
The clinical significance of BRAF and NRAS mutations in a clinic-based metastatic melanoma cohort.Br J Dermatol. 2013 Nov;169(5):1049-55. doi: 10.1111/bjd.12504. Br J Dermatol. 2013. PMID: 23855428
-
Differential chemosensitivity to antifolate drugs between RAS and BRAF melanoma cells.Mol Cancer. 2014 Jun 19;13:154. doi: 10.1186/1476-4598-13-154. Mol Cancer. 2014. PMID: 24941944 Free PMC article.
-
The role of MEK inhibitors in the treatment of metastatic melanoma.Curr Opin Oncol. 2014 Mar;26(2):196-203. doi: 10.1097/CCO.0000000000000050. Curr Opin Oncol. 2014. PMID: 24419498 Review.
-
Frequency of mutations in BRAF, NRAS, and KIT in different populations and histological subtypes of melanoma: a systemic review.Melanoma Res. 2020 Feb;30(1):62-70. doi: 10.1097/CMR.0000000000000628. Melanoma Res. 2020. PMID: 31274706 Free PMC article.
Cited by
-
Prognostic Value of NRAS Gene for Survival of Colorectal Cancer Patients: A Systematic Review and Meta-Analysis.Asian Pac J Cancer Prev. 2018 Nov 28;19(11):3001-3008. doi: 10.31557/APJCP.2018.19.11.3001. Asian Pac J Cancer Prev. 2018. PMID: 30484984 Free PMC article.
-
Differential responsiveness to BRAF inhibitors of melanoma cell lines BRAF V600E-mutated.J Transl Med. 2020 May 11;18(1):192. doi: 10.1186/s12967-020-02350-8. J Transl Med. 2020. PMID: 32393282 Free PMC article.
-
MEK targeting in N-RAS mutated metastatic melanoma.Mol Cancer. 2014 Mar 4;13:45. doi: 10.1186/1476-4598-13-45. Mol Cancer. 2014. PMID: 24588908 Free PMC article.
-
Performance comparison of three BRAF V600E detection methods in malignant melanoma and colorectal cancer specimens.Tumour Biol. 2015 Feb;36(2):1003-13. doi: 10.1007/s13277-014-2711-5. Epub 2014 Oct 16. Tumour Biol. 2015. PMID: 25318602 Free PMC article.
-
Bacillus Calmette-Guérin Immunotherapy for Cancer.Vaccines (Basel). 2021 May 1;9(5):439. doi: 10.3390/vaccines9050439. Vaccines (Basel). 2021. PMID: 34062708 Free PMC article. Review.
References
-
- Akslen LA, Angelini S, Straume O, et al. BRAF and NRAS mutations are frequent in nodular melanoma but are not associated with tumor cell proliferation or patient survival. J Investig Dermatol. 2005;125(2):312–317. - PubMed
Publication types
MeSH terms
Substances
LinkOut - more resources
Full Text Sources
Other Literature Sources
Medical
Research Materials
Miscellaneous

