. 2013:4:1837.
doi: 10.1038/ncomms2864.

Calfacilitin is a calcium channel modulator essential for initiation of neural plate development

Affiliations
Free PMC article

Calfacilitin is a calcium channel modulator essential for initiation of neural plate development

Costis Papanayotou et al. Nat Commun. 2013.
Free PMC article

Abstract

Calcium fluxes have been implicated in the specification of the vertebrate embryonic nervous system for some time, but how these fluxes are regulated and how they relate to the rest of the neural induction cascade is unknown. Here we describe Calfacilitin, a transmembrane calcium channel facilitator that increases calcium flux by generating a larger window current and slowing inactivation of the L-type CaV1.2 channel. Calfacilitin binds to this channel and is co-expressed with it in the embryo. Regulation of intracellular calcium by Calfacilitin is required for expression of the neural plate specifiers Geminin and Sox2 and for neural plate formation. Loss-of-function of Calfacilitin can be rescued by ionomycin, which increases intracellular calcium. Our results elucidate the role of calcium fluxes in early neural development and uncover a new factor in the modulation of calcium signalling.


Figures

Figure 1
Figure 1. Calfacilitin expression and regulation.
(a–f) Expression in the chick embryo at stages XII-10. Expression gradually becomes restricted to the central nervous system. (g, Top) A graft of Hensen’s node induces Calfacilitin; in section (g, bottom), Calfacilitin induction is seen in the host epiblast. (h, Top) FGF8 induces Calfacilitin; this is seen more clearly in section (h, bottom), which also reveals expression localized to the host epiblast next to the FGF8 bead. Scale bar, 300 μm in a; Scale bar, 100 μm in b,c,g,h; Scale bar, 120 μm in d,e; Scale bar, 500 μm in f, Scale bar, 60 μm in g bottom, h bottom.
Figure 2
Figure 2. Calfacilitin electrophysiological properties and interactions with calcium channel CaV1.2
Predicted aminoacid sequence (a) and membrane topology (predicted transmembrane domains underlined) (b) of Calfacilitin. The number on each of the loops corresponds to the position of a Myc epitope in constructs (Calfacilitin-myc1-7; see Supplementary Fig. 1) used for epitope mapping experiments. +: Stains with anti-myc without detergent; x: negative. (c) Normalized I–V curve for IBa. V0.5 (CaV1.2)=−12.44±0.5 mV (n=5). V0.5 (CaV1.2-Calfacilitin)=−15.4±0.8 mV (n=8). P=0.0245 (Student’s t-test). (d) Steady-state inactivation properties. V0.5 (CaV1.2)=-39.7±0.8 mV (n=6). V0.5 (CaV1.2-Calfacilitin)=−36.72±0.6 mV (n=5). P=0.0165 (Student’s t-test). (e) Representative IBa during depolarizations to Vmax and percentage IBa inactivation. (f) Representative ICa and percentage ICa inactivation during depolarizations to −10, 0 and 10 mV at 0.1 s after peak current. *P<0.05 (Student’s t-test). Error bars in panels cf correspond to the s.e.m. (g,h) Co-immunoprecipitation experiment demonstrating that Calfacilitin binds to CaV1.2. g shows the input lysate (western blot with anti-myc); (h) shows the results of precipitation with anti-CaV1.2 and detection with anti-myc. pcDNA3 was included as a control (lane 1) and the experiment performed with two different myc-tagged versions of Calfacilitin, in positions 1 (lane 2, Myc1) and 7 (lane 3, Myc7) (see b above). (i) Co-localization of Calfacilitin (here Myc7 construct; green) with CaV1.2 (HA-tagged; red) in HEK293T cells. Scale bar, 15 μm.
Figure 3
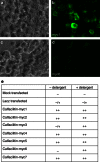
Figure 3. Experiment to elucidate the membrane topology of Calfacilitin.
(a–d) Examples of results obtained. (a,b) HEK293T cells transfected with Calfacilitin-myc1 and stained without detergent, seen by phase contrast (a) and fluorescence (b). Surface staining is seen. (c,d) cells stained with Calfacilitin-myc6 without detergent seen by phase contrast (c) and fluorescence (d)—no signal is apparent. (e) Summary of results of transfections of COS or HEK293T cells with Calfacilitin tagged with a myc epitope in different positions (as shown in Fig. 2b). —denotes no signal, −/+ denotes a very weak signal and ++ denotes strong staining with anti-myc. The deduced topology is shown in Fig. 2b. Scale bar (for ad), 30 μm.
Figure 4
Figure 4. Expression of the L-type calcium channels CaV1.2 and CaV1.3 in normal embryos.
(a–f) CaV1.2. Expression gradually becomes concentrated to neural plate precursors. (a) Mid-primitive streak stage (HH3+); (b) late primitive streak stage (HH4+); (c) early neurulation (HH6); (d) neural plate stage (HH7). (e,f) Sections through the levels indicated in (b,d), showing expression mainly in the epiblast. (g–j) In contrast, no significant expression of the CaV1.3 channel in seen in any embryonic region at primitive streak (g,h), neurulation (i) or neural tube (j) stages. Scale bar, 200 μm (a,b,g); Scale bar, 120 μm (cf,h); Scale bar, 90 μm (i); Scale bar, 230 μm (j).
Figure 5
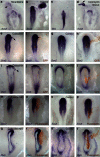
Figure 5. Calfacilitin is required for neural plate specification.
(a–d) Nicardipine inhibits neural plate development and neural induction by a grafted node (arrow) (a,b: DMSO control); (c) this treatment does not affect mesoderm (expression of Brachyury shown). The effect of nicardipine can be rescued by an ionomycin-soaked bead (d, arrow). (e–l) Gain-of-function: Calfacilitin (e,f,i,j) but not control GFP (g,h,k,l) expands the neural plate, revealed by the neural plate marker Sox2 (eh) and the border marker Dlx5 (il). (it) Loss-of-function: Calfacilitin MOs (m,n,q,r) unlike control MOs (o,p,s,t), reduce the neural plate, as seen by expression of the neural plate marker Sox2 (mp) and the border marker Dlx5 (qt). In situ probe (purple) indicated on the lower left of each panel. Anti-GFP (brown in f,h,j,l) or anti-fluorescein (for MO; brown in n,p,r,t) reveal electroporated cells. Scale bar, 100 μm (for all panels).
Figure 6
Figure 6. Both the organizer (Hensen’s node) and Calfacilitin increase intracellular calcium.
(ae) The organizer induces an increase in intracellular calcium in responding cells starting about 4 h after grafting. This example shows the ratio between green and red emissions of Fluo4/Fura-Red excited at 488 nm 0, 3, 4 and 6 h after grafting (ad; pseudo-colour encoded as a heat map). Panel e shows a time-scan of the changes in the green channel (Fluo4 signal) in the region of the graft. The site of the grafted node is outlined by a thin line in a. (fm) Embryo loaded with the calcium indicator Rhod-2 after electroporation with GFP alone (fh) or Calfacilitin+GFP (ik), imaged 6 h after electroporation. Calfacilitin increases the calcium signal as compared with GFP alone. Scans showing the relative intensity of the Rhod-2 signal in g,j at the position indicated by the line are shown in (l,m), respectively, (the scan line was positioned parallel to the axis of the primitive streak, ~150 μm lateral to the midline). Scale bar (ad,fk), 100 μm.
Figure 7
Figure 7. Calfacilitin is required for neural induction.
Calfacilitin MOs (a,b) but not control MOs (c,d) block induction of Sox2 by Hensen’s node, but do not affect induction of the earlier marker Sox3 (e,f). The effect can be rescued both by Calfacilitin cDNA (g,h top, bottom shows a section revealing Sox2 rescue in the host epiblast) and by the Calcium ionophore ionomycin (i,j). Hensen’s node grafts have reduced ability to induce Geminin in Calfacilitin-MO-electroporated epiblast (k,l) as compared with control-MO epiblast (m,n). This induction can also be rescued either by co-electroporation of Calfacilitin cDNA (o,p top, bottom shows a section revealing Geminin rescue in the host epiblast) or by ionomycin beads (q,r). In situ probe (purple) indicated on the lower left of each panel. Anti-fluorescein (to reveal fluorescein-labelled MO; brown in b,d,f,h top, j,l,n,p,r) reveal electroporated cells. Scale bar, 100 μm (a,b,e,f,h bottom,k,l); Scale bar, 180 μm (c,d,i,j,or); Scale bar, 400 μm (g,h top, m,n); Scale bar, 50 μm (p bottom).
Figure 8
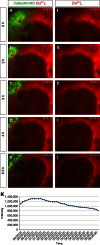
Figure 8. Calfacilitin-MO lowers intracellular calcium in epiblast adjacent to a grafted Hensen’s node.
Embryos were loaded with the Ca2+ indicator Rhod-2 and electroporated with Calfacilitin MOs before grafting an organizer (Hensen’s node) onto the electroporated region (stippled circle at 0 h). An embryo is shown 0 (a,f), 2 (b,g), 3 (c,h), 4 (d,i) and 6.5 (e,j) hours after the graft, revealing progressive loss of calcium signal under the graft. The left panels show the Ca2+ signal (red) overlapped with the fluorescein (green) revealing the MO; the right panels reveal only the Ca2+ signal. (k) Quantification of the Ca2+ signal in the MO-electroporated epiblast adjacent to the node graft of the same embryo (measured in the area outlined by a circle in a, comprising 13,996 pixels) over time. Compare with Fig. 6e for node graft without MO-electroporation). Scale bar (aj), 100 μm.

Similar articles

Cited by

References

    1. Harland R., Gerhart J. Formation and function of Spemann's organizer. Annu. Rev. Cell Dev. Biol. 13, 611–667 (1997). - PubMed
    1. Nakamura O., Toivonen S. (eds). in Organizer: a Milestone of a Half-century from Spemann Elsevier/North Holland: Amsterdam, (1978).
    1. Spemann H., Mangold H. Über Induktion von Embryonalanlagen durch Implantation artfremder Organisatoren. Roux’ Arch. EntwMech. Org. 100, 599–638 (1924).
    1. Storey K. G., Crossley J. M., De Robertis E. M., Norris W. E., Stern C. D. Neural induction and regionalisation in the chick embryo. Development 114, 729–741 (1992). - PubMed
    1. Gallera J. Primary induction in birds. Adv. Morph. 9, 149–180 (1971). - PubMed

Publication types

MeSH terms

Associated data