. 2013:4:1840.
doi: 10.1038/ncomms2835.

Dendrogenin A arises from cholesterol and histamine metabolism and shows cell differentiation and anti-tumour properties

Affiliations
Free PMC article

Dendrogenin A arises from cholesterol and histamine metabolism and shows cell differentiation and anti-tumour properties

Philippe de Medina et al. Nat Commun. 2013.
Free PMC article

Abstract

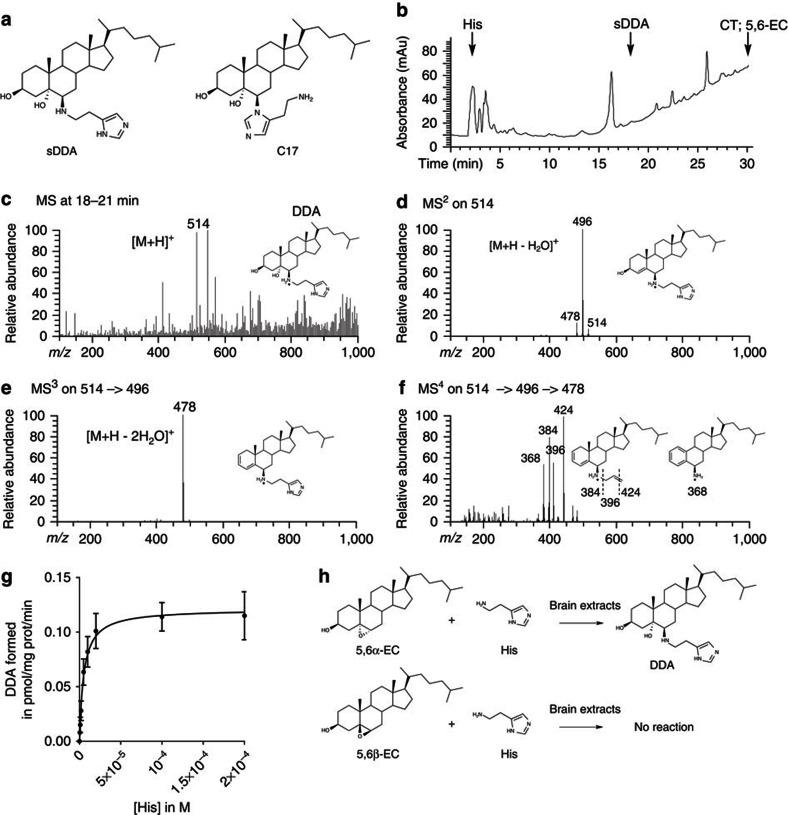
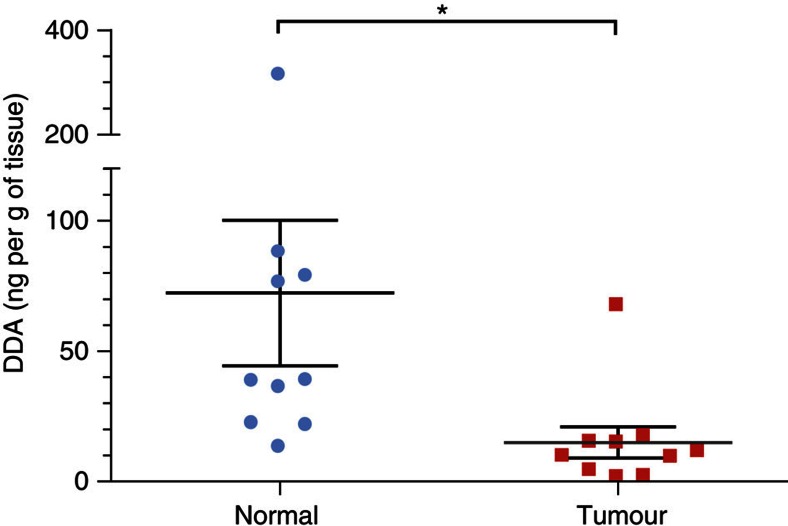
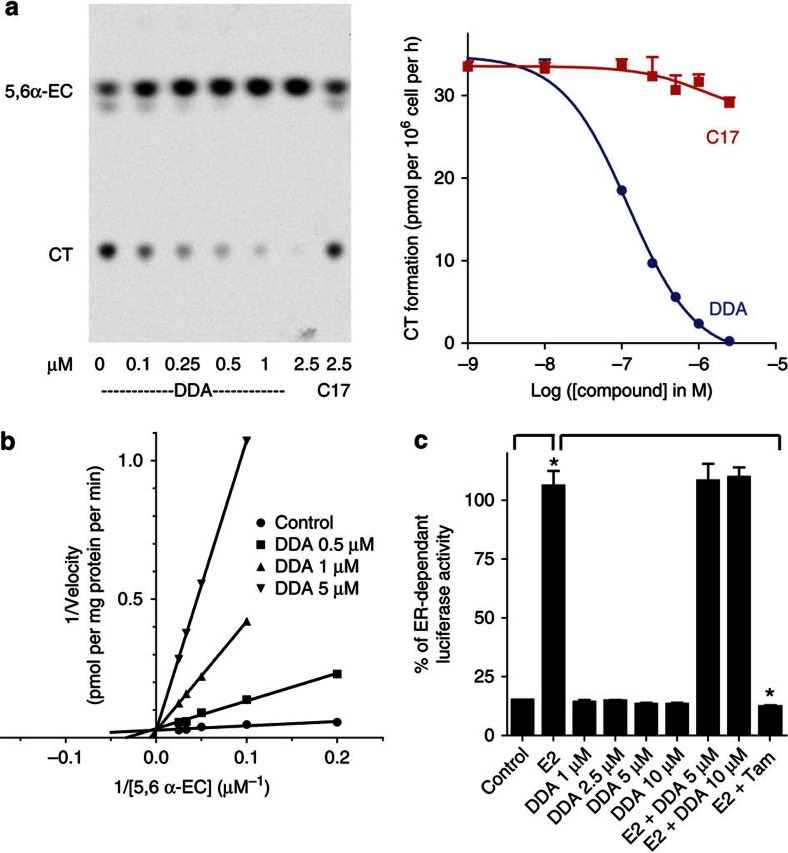
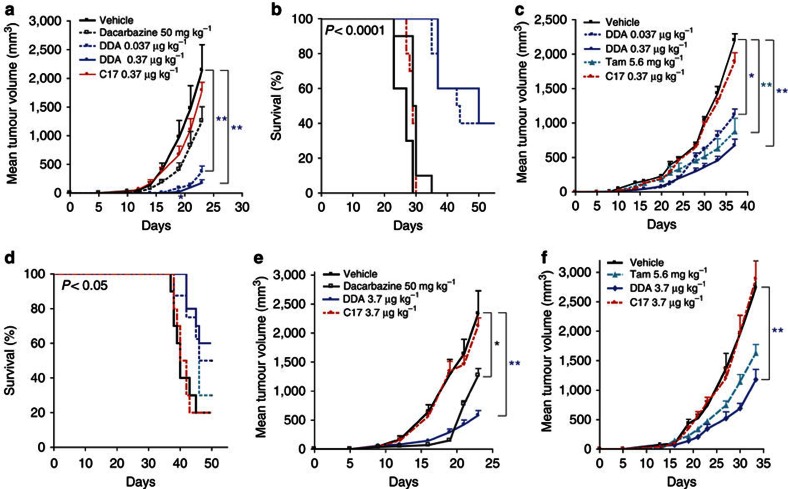
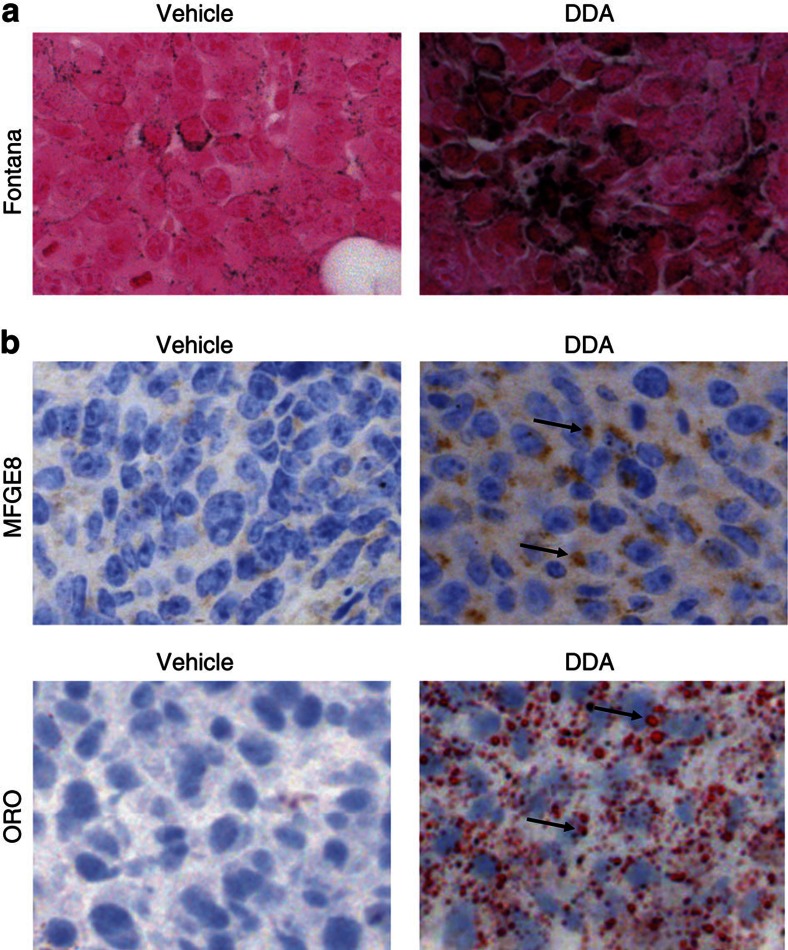
We previously synthesized dendrogenin A and hypothesized that it could be a natural metabolite occurring in mammals. Here we explore this hypothesis and report the discovery of dendrogenin A in mammalian tissues and normal cells as an enzymatic product of the conjugation of 5,6α-epoxy-cholesterol and histamine. Dendrogenin A was not detected in cancer cell lines and was fivefold lower in human breast tumours compared with normal tissues, suggesting a deregulation of dendrogenin A metabolism during carcinogenesis. We established that dendrogenin A is a selective inhibitor of cholesterol epoxide hydrolase and it triggered tumour re-differentiation and growth control in mice and improved animal survival. The properties of dendrogenin A and its decreased level in tumours suggest a physiological function in maintaining cell integrity and differentiation. The discovery of dendrogenin A reveals a new metabolic pathway at the crossroads of cholesterol and histamine metabolism and the existence of steroidal alkaloids in mammals.


Conflict of interest statement

P.D.M., M.R.P. and L.M. are employees of the company Affichem of which S.S.-P. and M.P. are founders. The remaining authors declare no competing financial interests.

Figures

Figure 1
Figure 1. Characterization and formation of DDA in mouse brain homogenates.
(a) Chemical structure of sDDA and synthetic C17. (b) HPLC profile from a total mouse brain extract. The extraction of sterols and HPLC separation were carried out as described in the ‘Methods’ section. Arrows indicate peaks corresponding to the authentic standards: His, sDDA, CT and 5,6-EC. The fractions collected between 18 and 21 min from HPLC purification of the mice brain extract were submitted to nano-electrospray ionization MS fragmentation. DDA (m/z 514) and deuterated d7-DDA (m/z 521) were fragmented simultaneously using the following parameters: parent ion mass, m/z 518; parent ion isolation width, m/z 8; and collision energy, 33%. MS3 analysis of the DDA and d7-DDA fragments at m/z 496 (Supplementary Fig. S2) and 503 (Supplementary Fig. S5) was performed using the following parameters: parent ion mass, m/z 500; parent ion isolation width, m/z 8; and collision energy, 45%. MS4 analysis of the DDA and d7-DDA fragments at m/z 478 and 485 was performed using the following parameters: parent ion mass, m/z 482; parent ion isolation width, 8 m/z; and collision energy, 50%. MS4 quantification of DDA was calculated from the m/z 424/431 ratio obtained by averaging 100 spectra. (c) (MS1) resulted in a molecular ion of [M+H]+ (m/z 514) obtained in MS1. (d) MS2 fragmentation of the [M+H]+ (m/z 514). (e) MS3 fragmentation of the (m/z 496) peak obtained in MS2. (f) MS4 fragmentation of the (m/z 478) peak obtained in MS3. (g) Michaelis–Menten plot of DDA formation. 2 μM of [14C]-5,6α-EC and His (0.5–200 μM) were incubated 10 min at 37 °C in the presence of mouse brain homogenate. Lipids were extracted and analysed by thin-layer chromatography, and DDA was quantified as described in the ‘Methods’ section. Experiments were repeated at least three times in duplicates. The data presented are the means±s.e.m. of all experiments. (h) Schemes describing the transformation of 5,6α-EC and 5,6β-EC in the presence of His and brain extracts.
Figure 2
Figure 2. Quantification of endogenous DDA in human breast tumours and normal tissues.
Quantification of endogenous DDA from human breast tumours and adjacent normal tissues from 10 patients was carried out as described in Fig. 1 caption. Peaks m/z 496 (sDDA and C17) and 367 (C17) were used to determine the relative amounts of each molecule in samples before quantification. Each symbol represents the mean concentration of DDA determined in each normal or tumour sample that was analysed twice. The black lines indicate the group sample mean±s.e.m., *P<0.05 (Student’s t-test).
Figure 3
Figure 3. DDA is the most potent natural inhibitor of ChEH.
MCF-7 cells were incubated with 0.6 μmol l−1 [14C]-5,6α-EC at 37 °C for 8 h with or without the indicated concentrations of DDA or C17. ChEH activity was assayed by measuring the conversion of [14C]-5,6α-EC to [14C]-CT by thin-layer chromatography (TLC) and quantified by densitometric analysis. (a) On the left panel, a representative autoradiogram of a TLC run from three independent experiments; on the right panel, the dose–response curves of the inhibition of [14C]-CT formation measured by TLC with DDA (circle) or C17 (square) at the indicated concentrations. The curves represent the mean±s.e.m. of three independent experiments and were used to calculate the IC50. (b) Modality of ChEH inhibition by DDA. The relationship between the conversion rates of 5,6α-EC to CT and DDA concentrations is shown using 0.5, 1 and 5 μM DDA with MCF-7 cell extracts. A double reciprocal plot of velocity versus [14C]-5,6α-EC at the given DDA concentrations is presented. Experiments were repeated at least three times in duplicates. The data presented are the mean±s.e.m. of all experiments. (c) Measurement of ER-dependent transcriptional activity in MELN cells. Cells were incubated with the solvent vehicle (control), 10 nM E2 or increasing concentrations of DDA with or without 10 nM 17β-estradiol (E2) or 1 μM Tam with 10 nM E2. Experiments were repeated at least three times in duplicates. The data presented are the means±s.e.m. of all experiments. P<0.001 compared with control cells.
Figure 4
Figure 4. DDA inhibited the growth of B16F10 melanoma and TS/A mammary tumours implanted into immunocompetent mice and enhanced animal survival.
Immunocompetent mice were implanted s.c. with (a) B16F10 cells or (b,c) TS/A cells and animals (n=10 mice per group) were treated every 5 days starting on the day of tumour implantation with the indicated doses of either dacarbazine (intraperitoneally (i.p.)), DDA (s.c.), C17 (s.c.), vehicle (s.c.) or Tam (i.p.). Animals were monitored for tumour growth (a,c), *P<0.05; **P<0.01 (analysis of variance (ANOVA), Dunnett’s post test), and survival (b,d), *P<0.05; ***P<0.0001 (log-rank tests). Immunocompetent mice were implanted s.c. with (e) B16F10 cells or (f) TS/A cells, and when the tumour reached a volume of 50–100 mm3, animals (n=10 mice per group) were treated once per day with the indicated doses of dacarbazine (i.p.), DDA (s.c.), C17 (s.c.), vehicle (s.c.) or Tam (i.p.) and were monitored over time for tumour growth, *P<0.05; **P<0.01 (ANOVA, Dunnett’s post tests). The mean tumour volume±s.e.m is shown. The data are representative of three independent experiments.
Figure 5
Figure 5. DDA treatment induced in vivo differentiation of B16F10 and TS/A tumours implanted into immunocompetent mice.
Histology of tumours resected from immunocompetent mice treated with vehicle (left panels) or DDA (3.7 μg kg−1) (right panels) and stained for specific markers of cell differentiation. Paraffin sections were stained with haematoxylin and eosin for histomorphological analyses. (a) B16F10 tumour sections from mice treated for 23 days were analysed for melanin production with Masson–Fontana staining (black labelling). (b) TS/A tumour sections from mice treated for 30 days were analysed for MFGE8 expression with a specific antibody (brown staining, indicated by arrows) and for neutral lipid production by ORO staining (red labelling, indicated by arrows). For lipid staining, frozen sections were fixed in 10% neutral-buffered formalin and then stained with ORO and counterstained with haematoxylin. Immunohistochemical staining was done on paraffin-embedded tissue sections, using a specific hamster monoclonal to MFGE8 antibody (4 μg ml−1). Immunostaining of paraffin sections was preceded by an antigen retrieval technique by heating in 10 mM citrate buffer, pH 6, with a microwave oven twice for 10 min each. After incubation with the antibody for 1 h at room temperature, sections were incubated with biotin-conjugated polyclonal anti-hamster immunoglobulin antibody followed by the streptavidin-biotin-peroxidase complex (Vectastain ABC kit, Vector Laboratories, CA) and were then counterstained with haematoxylin. Negative controls were incubated in buffered solution without primary antibody. Magnification is × 200.

References

    1. Newman J. W., Morisseau C., Hammock B. D. Epoxide hydrolases: their roles and interactions with lipid metabolism. Prog. Lipid Res. 44, 1–51 (2005). - PubMed
    1. Poirot M., Silvente-Poirot S., Weichselbaum R. R. Cholesterol metabolism and resistance to tamoxifen. Curr. Opin. Pharmacol. 12, 683–689 (2012). - PubMed
    1. de Medina P. et al.. Importance of cholesterol and oxysterols metabolism in the pharmacology of tamoxifen and other AEBS ligands. Chem. Phys. Lipids 164, 432–437 (2011). - PubMed
    1. de Medina P., Paillasse M. R., Segala G., Poirot M., Silvente-Poirot S. Identification and pharmacological characterization of cholesterol-5,6-epoxide hydrolase as a target for tamoxifen and AEBS ligands. Proc. Natl Acad. Sci. USA 107, 13520–13525 (2010). - PMC - PubMed
    1. Payre B. et al.. Microsomal antiestrogen-binding site ligands induce growth control and differentiation of human breast cancer cells through the modulation of cholesterol metabolism. Mol. Cancer Ther. 7, 3707–3718 (2008). - PubMed

Publication types

MeSH terms