. 2013 Aug;22(8):1820-8.
doi: 10.1007/s00586-013-2798-1. Epub 2013 May 15.

Evaluation of intervertebral disc cartilaginous endplate structure using magnetic resonance imaging

Affiliations

Evaluation of intervertebral disc cartilaginous endplate structure using magnetic resonance imaging

Sung M Moon et al. Eur Spine J. 2013 Aug.

Abstract

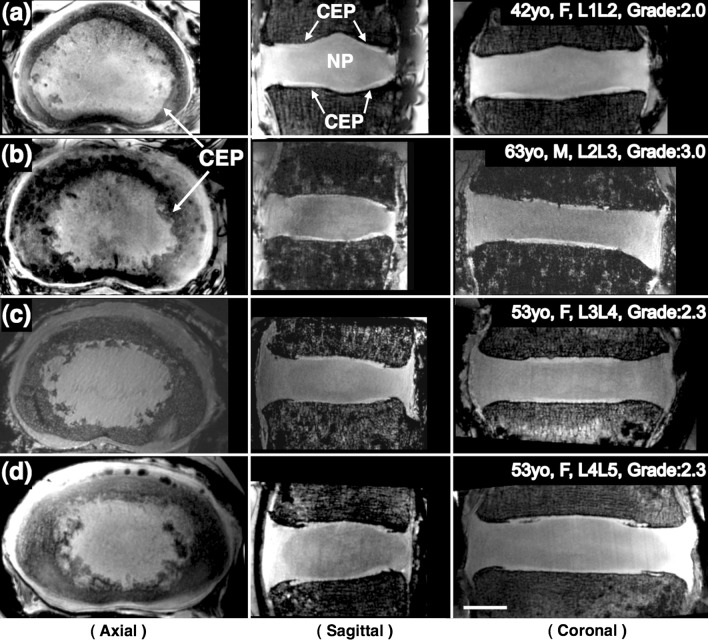
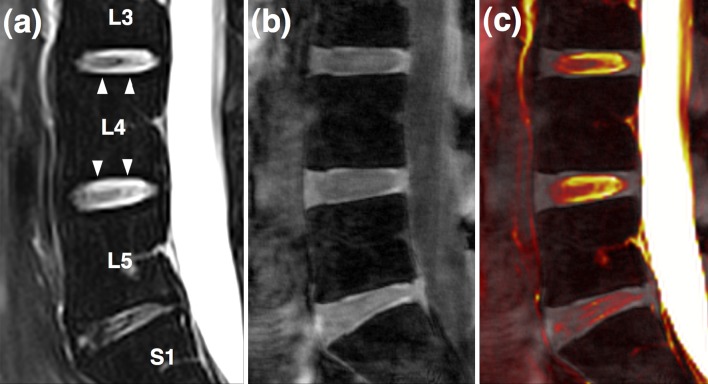
Purpose: The cartilaginous endplate (CEP) is a thin layer of hyaline cartilage positioned between the vertebral endplate and nucleus pulposus (NP) that functions both as a mechanical barrier and as a gateway for nutrient transport into the disc. Despite its critical role in disc nutrition and degeneration, the morphology of the CEP has not been well characterized. The objective of this study was to visualize and report observations of the CEP three-dimensional morphology, and quantify CEP thickness using an MRI FLASH (fast low-angle shot) pulse sequence.

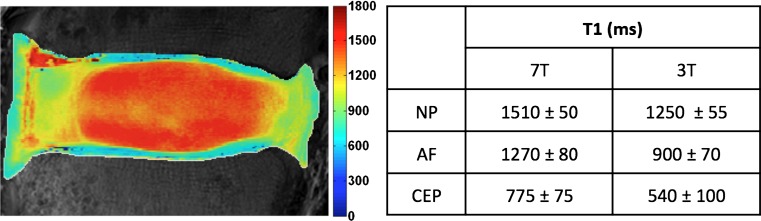
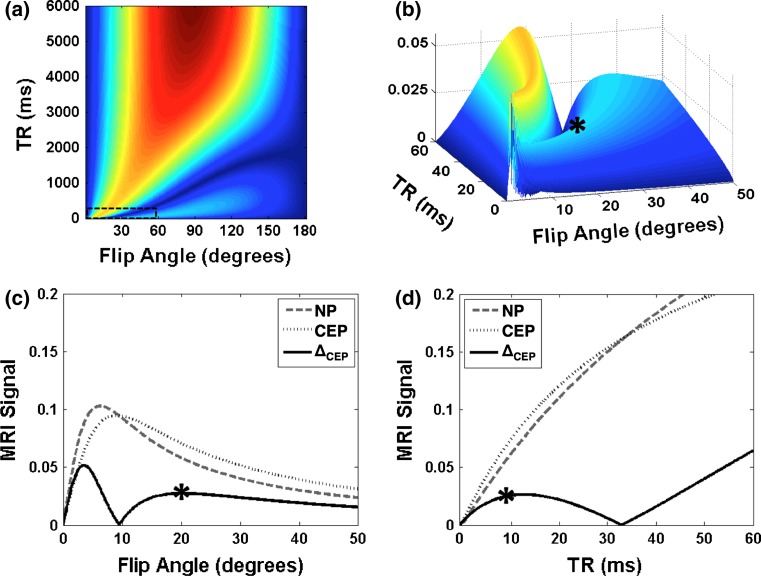
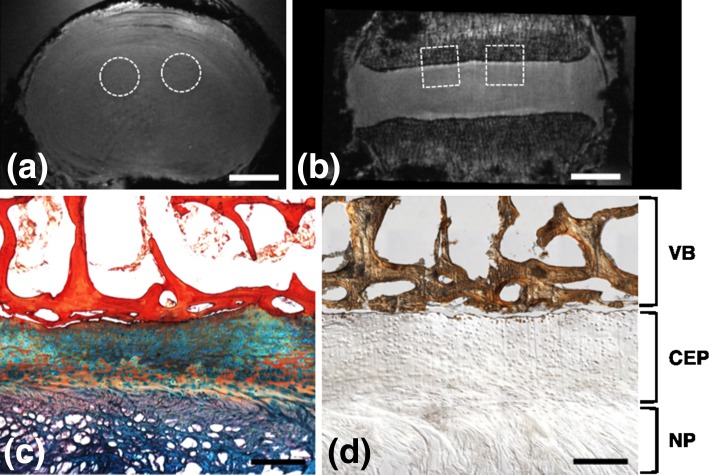
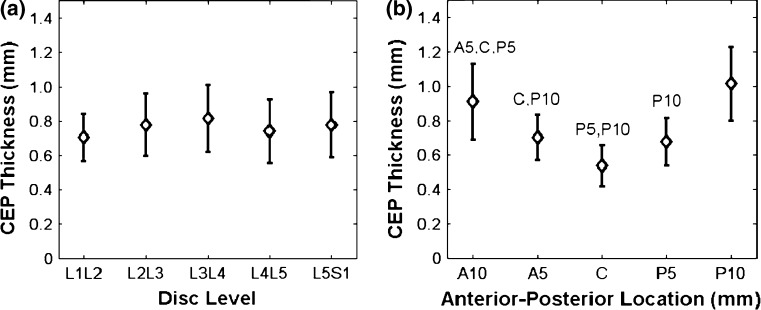
Methods: MR imaging of ex vivo human cadaveric lumbar spine segments (N = 17) was performed in a 7T MRI scanner with sequence parameters that were selected by utilizing high-resolution T1 mapping, and an analytical MRI signal model to optimize image contrast between CEP and NP. The CEP thickness at five locations along the mid-sagittal AP direction (center, 5 mm, 10 mm off-center towards anterior and posterior) was measured, and analyzed using two-way ANOVA and a post hoc Bonferonni test. For further investigation, six in vivo volunteers were imaged with a similar sequence in a 3T MRI scanner. In addition, decalcified and undecalcified histology was performed, which confirmed that the FLASH sequence successfully detected the CEP.

Results: CEP thickness determined by MRI in the mid-sagittal plane across all lumbar disc levels and locations was 0.77 ± 0.24 mm ex vivo. The CEP thickness was not different across disc levels, but was thinner toward the center of the disc.

Conclusions: This study demonstrates the potential of MRI FLASH imaging for structural quantification of the CEP geometry, which may be developed as a technique to evaluate changes in the CEP with disc degeneration in future applications.


Figures

Fig. 1
Fig. 1
T1 map of a healthy disc, obtained at 7T (scale bar in ms). The table shows mean T1 values within each disc substructure, obtained at both 7T and 3T. AF annulus fibrosus
Fig. 2
Fig. 2
Computed MRI signals and image contrast at 7T. a NP-CEP image contrast (ΔCEP), according to Eq. 2, over the full range of the parameters flip angle and TR. b Close-up 3D view within the small dashed box in (a). Asterisk (*) indicates the point chosen as optimal. c, d Computed NP (dashed) and CEP (dotted) MRI signals, and image contrast (ΔCEP, solid) versus flip angle at optimal TR (9 ms) (c) and versus TR at optimal flip angle (20°) (d)
Fig. 3
Fig. 3
MRI images of four different specimens with 200 μm isotropic resolution acquired at 7T. Three-plane views reformatted from the same isotropic dataset of each specimen clearly demonstrate the CEPs (arrows) clearly, which are located between the vertebral body and the NP. Axial views show that the shape and size of the CEP can vary considerably for different subjects and levels: a 47 years, female, L1L2; b 63 years, male, L2L3; c 53 years, female, L3L4; d 53 years, female, L4L5. Scale bar = 1 cm
Fig. 4
Fig. 4
MRI and histology images of the same specimen (63 years male, L2L3, Grade 2.6). Axial (a) and coronal (b) FLASH MRI of the whole disc, showing approximate locations of biopsy punches used for histological analysis. c Representative histology section of the CEP stained with Alcian blue (glycosaminoglycans) and picrosirius red (collagen), showing adjacent NP and vertebral bone. d Von Kossa staining of an undecalcified section, showing regions of bone distinct from CEP and minimal CEP calcification. (Scale bars in a and b = 1 cm and in c and d = 0.5 mm; VB vertebral bone)
Fig. 5
Fig. 5
In vivo data from a healthy volunteer obtained at 3T. a Routine T2-weighted mid-sagittal image b 3D FLASH image c fusion image of (a) and (b) showing that high-intensity regions (arrowheads) in image (a) are not co-localized with cartilaginous endplates
Fig. 6
Fig. 6
CEP thicknesses in specimens, as measured on mid-sagittal MRI slices: a at different disc levels b at different anterior-posterior locations (C center, A5, A10 = 5 and 10 mm off the center towards anterior, P5, P10 = 5 and 10 mm off the center towards posterior). Letters on top of error bars indicate significance (p < 0.005) between measured locations

References

    1. Ferguson SJ, Steffen T. Biomechanics of the aging spine. Eur Spine J. 2003;12:S97–103. doi: 10.1007/s00586-003-0621-0. - DOI - PMC - PubMed
    1. Adams MA, Dolan P. Spine biomechanics. J Biomech. 2005;38:1972–1983. doi: 10.1016/j.jbiomech.2005.03.028. - DOI - PubMed
    1. Louma K, Riihimaki H, Luukkonen R, et al. Low back pain in relation to lumbar disc degeneration. Spine. 2000;24:487–492. doi: 10.1097/00007632-200002150-00016. - DOI - PubMed
    1. Peng B, Hou S, Wu W, et al. The pathogenesis and clinical significance of a high-intensity zone (HIZ) of lumbar intervertebral disc on MR imaging in the patient with discogenic low back pain. Eur Spine J. 2006;15:583–587. doi: 10.1007/s00586-005-0892-8. - DOI - PMC - PubMed
    1. Videman T, Nurminen M. The occurrence of annular tears and their relation to lifetime back pain history: a cadaveric study using barium sulfate discography. Spine. 2004;29:2668–2676. doi: 10.1097/01.brs.0000146461.27105.2b. - DOI - PubMed

Publication types

LinkOut - more resources