. 2013 Aug;23(8):1283-94.
doi: 10.1101/gr.155499.113. Epub 2013 May 14.

Proteome-wide discovery of mislocated proteins in cancer

Affiliations

Proteome-wide discovery of mislocated proteins in cancer

KiYoung Lee et al. Genome Res. 2013 Aug.

Abstract

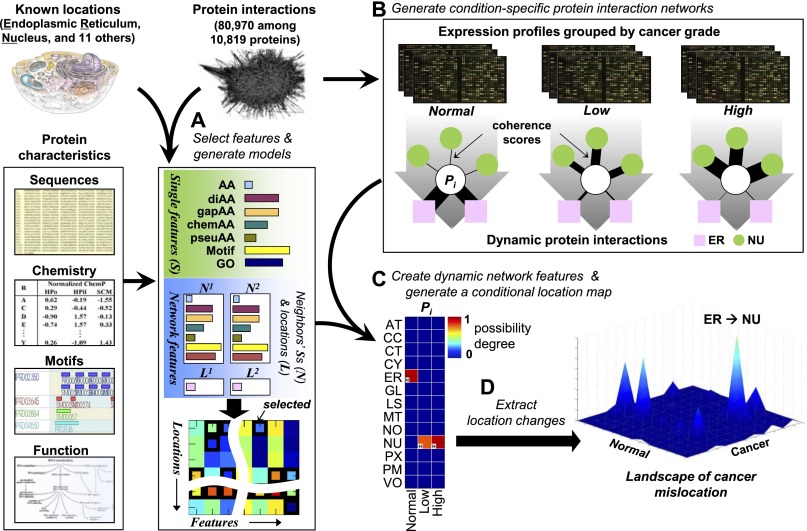
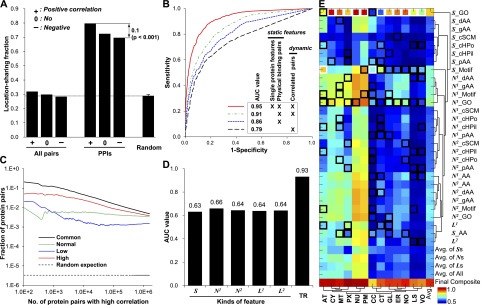
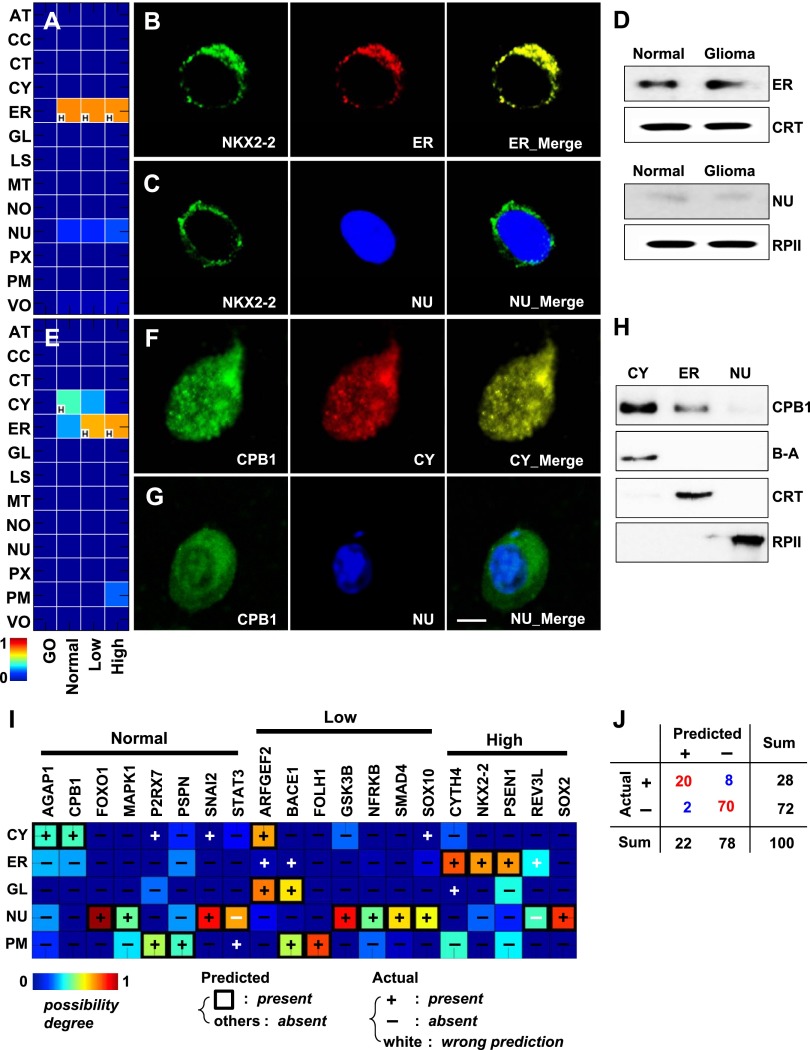
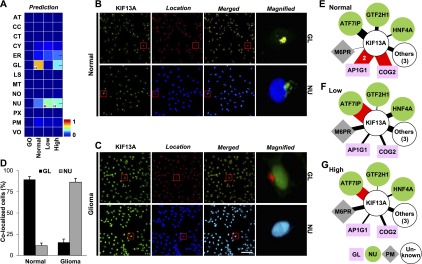
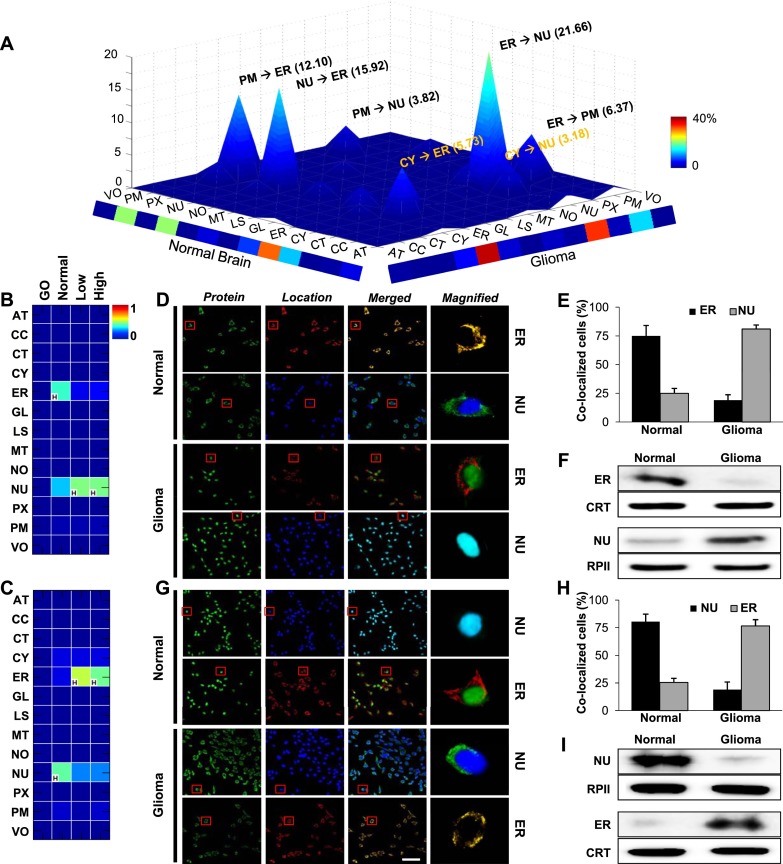
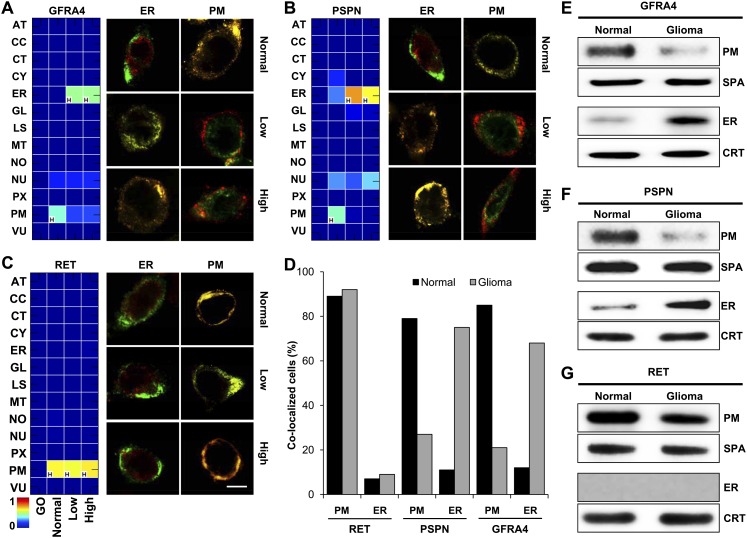
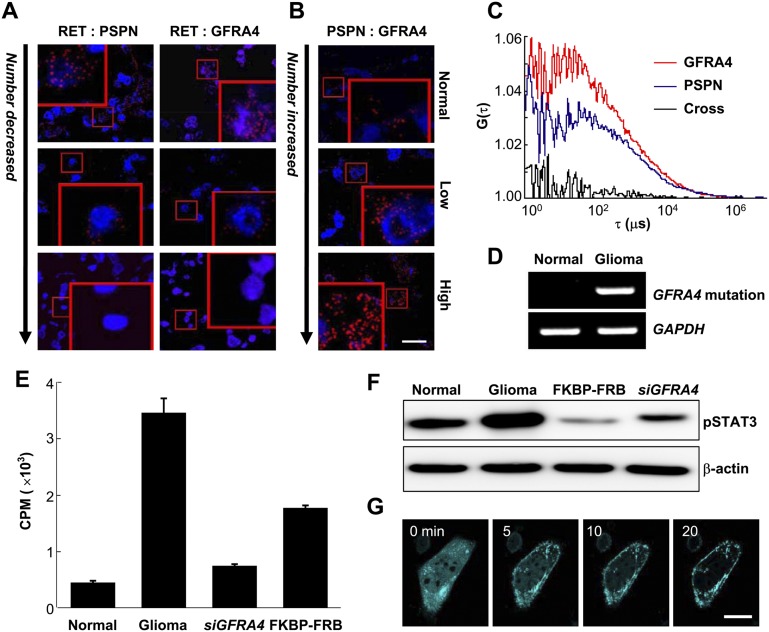
Several studies have sought systematically to identify protein subcellular locations, but an even larger task is to map which of these proteins conditionally relocates in disease (the mislocalizome). Here, we report an integrative computational framework for mapping conditional location and mislocation of proteins on a proteome-wide scale, called a conditional location predictor (CoLP). Using CoLP, we mapped the locations of over 10,000 proteins in normal human brain and in glioma. The prediction showed 0.9 accuracy using 100 location tests of 20 randomly selected proteins. Of the 10,000 proteins, over 150 have a strong likelihood of mislocation under glioma, which is striking considering that few mislocation events have been identified in this disease previously. Using immunofluorescence and Western blotting in both primary cells and tissues, we successfully experimentally confirmed 15 mislocations. The most common type of mislocation occurs between the endoplasmic reticulum and the nucleus; for example, for RNF138, TLX3, and NFRKB. In particular, we found that the gene for the mislocating protein GFRA4 had a nonsynonymous point mutation in exon 2. Moreover, redirection of GFRA4 to its normal location, the plasma membrane, led to marked reductions in phospho-STAT3 and proliferation of glioma cells. This framework has the potential to track changes in protein location in many human diseases.


Figures

Figure 1.
Figure 1.
Proteome-wide prediction of protein mislocation. (A) A protein is described by its sequence, chemical properties, motifs, and functions (single protein features) together with a description of its network neighborhood (capturing the features of its neighbors and their subcellular locations, if known). The best combination of features for each location is selected using a DC-kNN classifier. (B) Condition-dependent dynamic network features are generated by assigning different weights to each neighbor of a protein, depending on their similarity in gene expression profiles. (C) Selected features from A are combined with condition-dependent networks from B to compute a CLM for the protein, listing the quantitative possibility that the protein is in each location under each condition. (D) Mislocations are identified by calculating differences in degrees of possibility across conditions.
Figure 2.
Figure 2.
Models generated and usefulness of coherent protein interactions for location prediction. (A) The percentage of protein pairs sharing at least one location, calculated from different sets of proteins. “Random” was calculated as the average of 1000 randomly selected interaction sets with the same number of interactions as the original protein network. (B) Leave-two-out cross-validation with a DC-kNN classifier was used to assess the effect of static and network features on the accuracy of predicting known subcellular locations. (C) Fractions of protein pairs with known interactions among the top-k pairs with highest correlations in expression. “Common” indicates pairs common to normal brain (Normal) and low (Low)- and high (High)-grade gliomas. (D) Average AUC values of different feature sets, including S, ND, and LD. Here, the “TR” category means the final average AUC value of the selected models for 13 locations in the training stage. “D” indicates the distance of incorporated network neighbors. (E) Generated models with selected feature sets for individual locations using a DC-kNN classifier. Black and white squares represent selected feature sets for each location, with the white square denoting the best feature set overall. The last row indicates the AUC values for prediction of individual locations. The last column indicates the average AUC values of individual feature sets across the 13 locations considered.
Figure 3.
Figure 3.
Novel protein locations in normal brain and glioma and predictive performance. (A) Conditional location map for NKX2-2. A possibility degree between 0 and 1 (blue to red gradient) was assigned to each of 13 subcellular locations (rows) across three conditions: normal brain, low- and high-grade gliomas (columns). The letter “H” in the lower left-hand corner of the panels marks the location with the highest degree of possibility among the 13 locations considered for each condition. (B) A series of three images of the same cell from normal brain tissue, showing anti-NKX2-2 (left, green), the ER (middle, red), or a merged image (right). The yellow color in the right panel indicates high overlap between NKX2-2 and the ER. (C) A second series showing anti-NKX2-2 (left, green), a nuclear marker (middle, blue), and a merged image (right). (D) Results of cellular subfractionation and Western blotting to determine the location of NKX2-2 in normal brain and primary glioma cells. (E) Conditional location map for CPB1. (F,G) Cells stained with anti-CPB1 (green) and a cytosolic (F, red) or nuclear (G, blue) marker in normal brain tissue. Scale bar, 5 μm. (H) Results of cellular subfractionation and Western blotting to determine the location of CPB1 using normal brain primary cells. (I) Heat map of immunochemistry validation results. Twenty proteins (columns) were interrogated at up to five locations (rows) using two-dimensional imaging. Predictions overlaid with experimental observations (+ present or – absent). The color of the heat map indicates the predicted score, here, the degree of possibility. Symbols are colored black if predictions are correct; otherwise, they are white. (J) Validation statistics from I summarized in tabular form. See Supplemental Figures S7 and S8 for antibody specificity tests for the locations and the proteins used in this study. (β-A) beta-actin for a cytosol marker, (CRT) calreticulin for endoplasmic reticulum, (RPII) RNA polymerase II for nucleus.
Figure 4.
Figure 4.
Prediction and validation of KIF13A mislocation in glioma tissues and cells. (A) Conditional location map for KIF13A, for which the highest signal under normal conditions was in the Golgi apparatus (GL), but in low- and high-grade gliomas was in the nucleus (NU). The color indicates degree of possibility and “H” indicates the location with the highest degree of possibility within each condition. (B,C) Confocal images for KIF13A (green) together with markers for GL (red, row 1) or NU (blue, row 2) in normal (B) and glioma (C) tissues reveals results consistent with predictions. Scale bar, 5 μm. (D) The fraction of colocalized cells expressing GL and NU markers using >50,000 normal brain and glioma primary cells. Samples from four normal and five glioma subjects were used. (EG) The dynamic interaction neighborhood of KIF13A in normal brain (E), and low- (F) and high-grade (G) glioma tissues. Node color/shape indicates known protein locations. The width of each link is proportional to the expression coherence score, which is also indicated numerically for selected links. Red links indicate key interactions.
Figure 5.
Figure 5.
The landscape of protein mislocations in human glioma. (A) The landscape of mislocations in glioma. Each peak (z-axis) corresponds to the percentage of these mislocation candidates moving from one location (x-axis) to another (y-axis). Colors along the x and y margins represent the total percentage of proteins mislocating out of or into a location, respectively. (B,C) Conditional location maps of RNF138 and TLX3 are shown as examples of the most common mislocations from the ER to the nucleus (NU) or from the NU to ER, respectively. The color indicates degree of possibility and “H” indicates the location with the highest degree of possibility within each condition. (DI) Validation of RNF138 (D) and TLX3 (G) using confocal images for normal brain and glioma tissues. Confirmation of RNF138 (E,F) and TLX3 (H,I) mislocations by population assay and Western blot analyses using normal brain and glioma primary cells. For the population assay, samples from four normal and five glioma subjects were used. (Green) RNF138 or TLX3, (red) ER, (blue) NU, (CRT) calreticulin for an ER marker, (RPII) RNA polymerase II for nucleus. Scale bar, 5 μm.
Figure 6.
Figure 6.
Conditional location of GFRA4, PSPN, and RET in glioma. (AC) CLMs of GFRA4 (A), PSPN (B), and RET (C), and the results of confocal images in normal brain and glioma tissues. The color of the heat maps indicates predicted degree of possibility, and “H” indicates the location with the highest degree of possibility within each condition. Scale bar, 5 μm. (D) Location fraction of GFRA4, PSPN, and RET in normal brain and glioma primary cells. (E–G) Results of cellular subfractionation and Western blotting for locations of GFRA4 (E), PSPN (F), and RET (G) in normal brain and glioma primary cells. (SPA) sodium potassium ATPase (plasma membrane marker), (CRT) calreticulin (ER marker).
Figure 7.
Figure 7.
Dynamics of the GFRA4/PSPN/RET complex in glioma. (A,B) A proximity ligation assay was used to measure groups of close physical interactions between RET and PSPN, RET and GFRA4, and PSPN and GFRA4 in normal brain and glioma tissues. Red spots indicate physical proximity of the corresponding protein pair. Insets: 4× magnification. Scale bar, 20 μm. (C) Two fluorescence autocorrelation functions, G(τ), of GFP-PSPN (blue), TagRFP-GFRA4 (red), and one cross-correlation function (black), calculated from time traces of fluorescent fluctuations with high-grade glioma primary cells, as a function of correlation lag time τ (μs). (D) Reverse transcription-PCR of GFRA4 with axon 2 mutation. (E) Cell proliferation assay using thymidine incorporation in high-grade glioma cells with (“siGFRA4”) or without GFRA4 silencing (“glioma”), and using rapamycin for GFRA4 redirection to the plasma membrane (“FKBP-FBP”) in high-grade primary glioma cells. Bars indicate radioactivity in counts per minute (CPM; average ± standard deviation). (F) Immunoblot results using primary high-grade glioma (Glioma, FKBP-FRB, siGFRA4) and normal brain (Normal) cells. (G) Snapshots of GFRA4 redirection to the plasma membrane using the rapamycin technique in high-grade glioma cells. (Cyan) GFRA4. Scale bar, 100 μm.

Similar articles

Cited by

References

    1. Bacia K, Kim SA, Schwille P 2006. Fluorescence cross-correlation spectroscopy in living cells. Nat Methods 3: 83–89 - PubMed
    1. Bader GD, Donaldson I, Wolting C, Ouellette BF, Pawson T, Hogue CW 2001. BIND—the Biomolecular Interaction Network Database. Nucleic Acids Res 29: 242–245 - PMC - PubMed
    1. Bhasin M, Raghava GP 2004. ESLpred: SVM-based method for subcellular localization of eukaryotic proteins using dipeptide composition and PSI-BLAST. Nucleic Acids Res 32: W414–W419 - PMC - PubMed
    1. Chen Y, Xu D 2004. Global protein function annotation through mining genome-scale data in yeast Saccharomyces cerevisiae. Nucleic Acids Res 32: 6414–6424 - PMC - PubMed
    1. Chou KC, Cai YD 2005. Predicting protein localization in budding yeast. Bioinformatics 21: 944–950 - PubMed

Publication types

MeSH terms