

Solid fuel use for household cooking: country and regional estimates for 1980-2010
- PMID: 23674502
- PMCID: PMC3701999
- DOI: 10.1289/ehp.1205987
Solid fuel use for household cooking: country and regional estimates for 1980-2010
Abstract
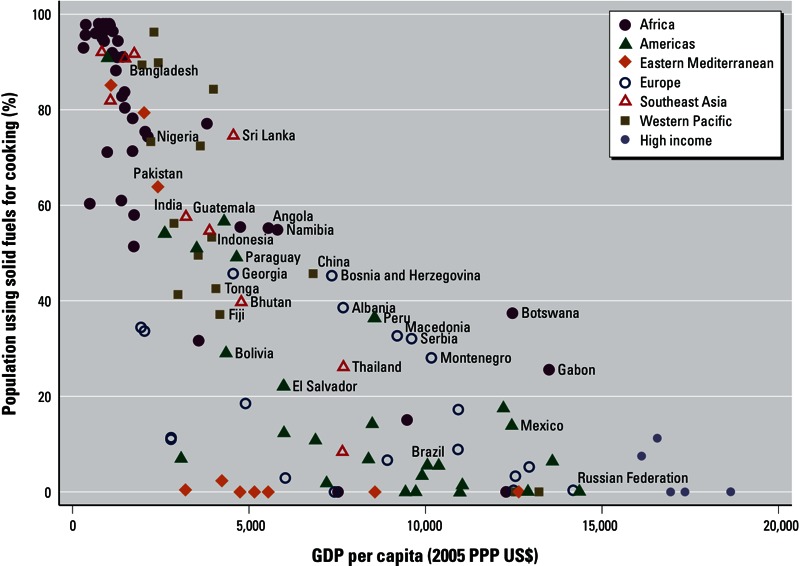
Background: Exposure to household air pollution from cooking with solid fuels in simple stoves is a major health risk. Modeling reliable estimates of solid fuel use is needed for monitoring trends and informing policy.
Objectives: In order to revise the disease burden attributed to household air pollution for the Global Burden of Disease 2010 project and for international reporting purposes, we estimated annual trends in the world population using solid fuels.
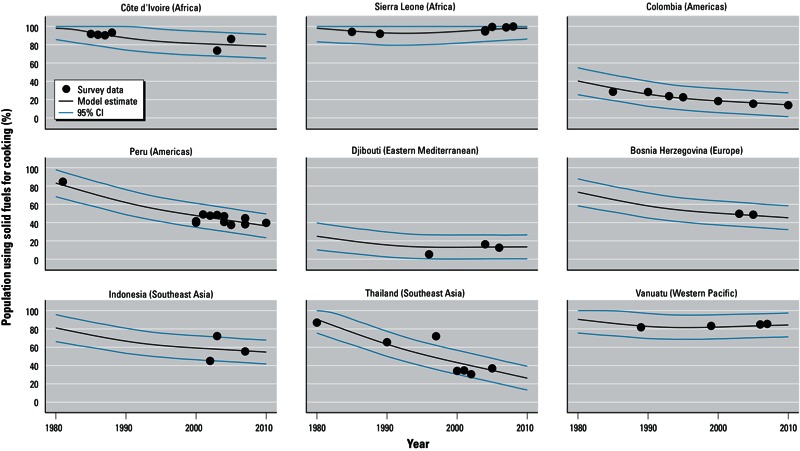
Methods: We developed a multilevel model based on national survey data on primary cooking fuel.
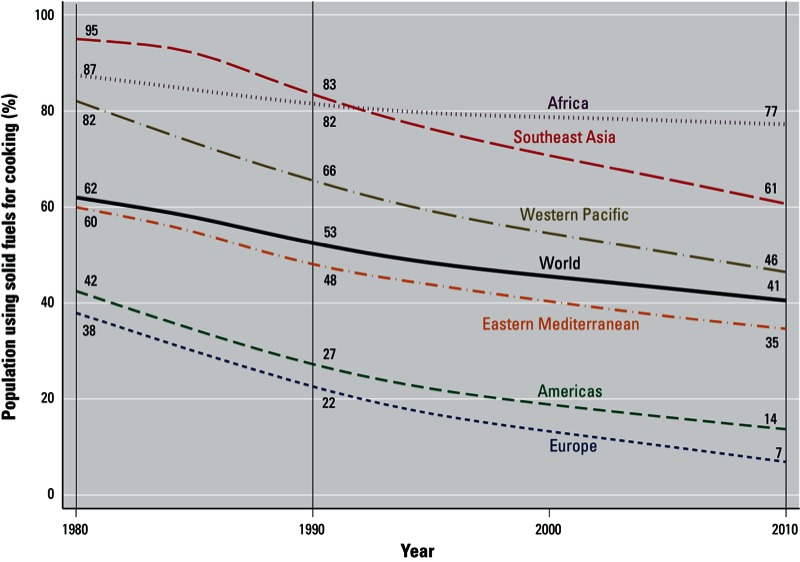
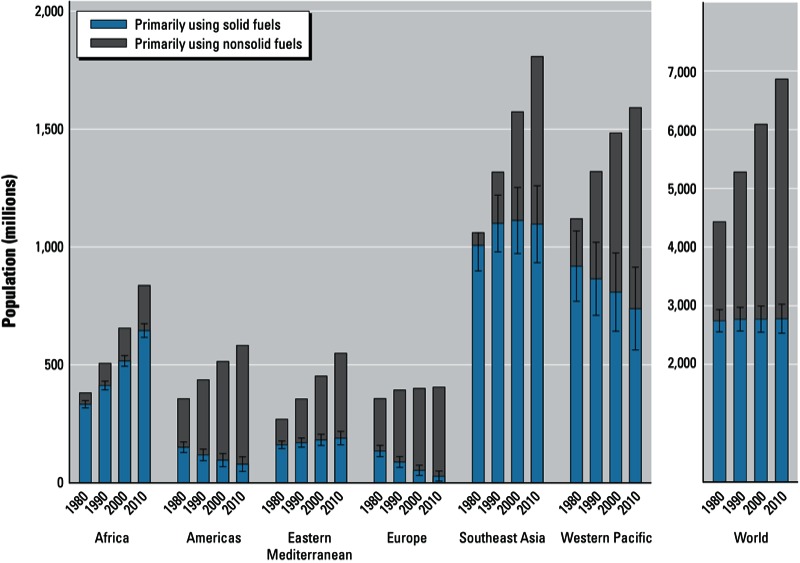
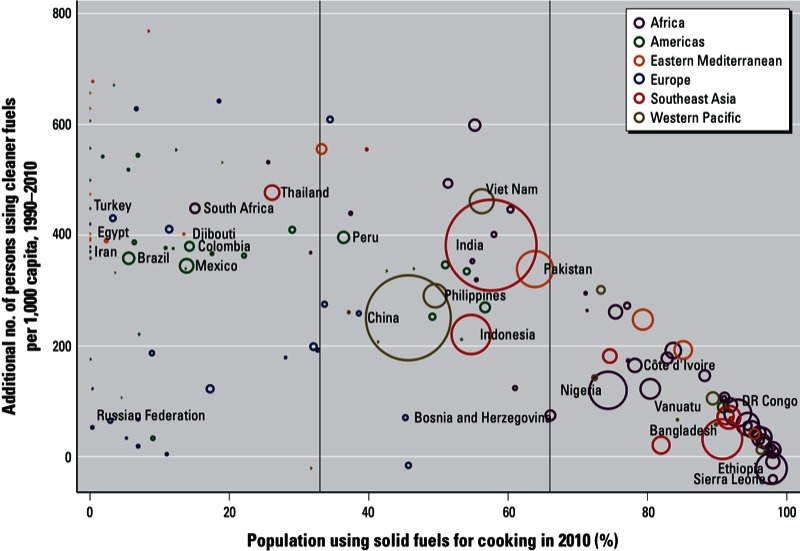
Results: The proportion of households relying mainly on solid fuels for cooking has decreased from 62% (95% CI: 58, 66%) to 41% (95% CI: 37, 44%) between 1980 and 2010. Yet because of population growth, the actual number of persons exposed has remained stable at around 2.8 billion during three decades. Solid fuel use is most prevalent in Africa and Southeast Asia where > 60% of households cook with solid fuels. In other regions, primary solid fuel use ranges from 46% in the Western Pacific, to 35% in the Eastern Mediterranean and < 20% in the Americas and Europe.
Conclusion: Multilevel modeling is a suitable technique for deriving reliable solid-fuel use estimates. Worldwide, the proportion of households cooking mainly with solid fuels is decreasing. The absolute number of persons using solid fuels, however, has remained steady globally and is increasing in some regions. Surveys require enhancement to better capture the health implications of new technologies and multiple fuel use.
Conflict of interest statement
The work leading to the results presented in the article has been developed, conducted, and implemented by the World Health Organization (WHO). This article reflects activities conducted by the Comparative Risk Assessment Expert Group for Household Air Pollution and undertaken for official reporting by the WHO. Some authors are staff members of the WHO. Those authors alone are responsible for the views expressed in this publication, which do not necessarily represent the views, decisions, or policies of the WHO. This article should not be reproduced for use in association with the promotion of commercial products, services or any legal entity. The WHO does not endorse any specific organization or products. Any reproduction of this article cannot include the use of the WHO logo.
The authors declare they have no actual or potential competing financial interests.
Figures
Comment in
-
Filling in the blanks on solid fuel use: new model illustrates trends, highlights needs.Environ Health Perspect. 2013 Jul;121(7):A227. doi: 10.1289/ehp.121-a227. Environ Health Perspect. 2013. PMID: 23816897 Free PMC article. No abstract available.
References
-
- Azevedo J. WBOPENDATA: Stata Module to Access World Bank Databases. 2011. Available: http://ideas.repec.org/c/boc/bocode/s457234.html [accessed 16 May 2013]
-
- Balakrishnan K, Sambandam S, Ramaswamy P, Mehta S, Smith KR. Exposure assessment for respirable particulates associated with household fuel use in rural districts of Andhra Pradesh, India. J Expo Anal Environ Epidemiol. 2004;14(suppl 1):S14–S25. - PubMed
-
- De Onis M, Blössner M, Borghi E, Morris R, Frongillo EA. Methodology for estimating regional and global trends of child malnutrition. Int J Epidemiol. 2004;33:1260–1270. - PubMed
-
- Edwards RD, Smith KR, Zhang J, Ma Y. Implications of changes in household stoves and fuel use in China. Energy Policy. 2004;32:395–411.
-
- Goldstein H. 2010. Multilevel Statistical Models. 4th ed. West Sussex, UK:Wiley.
Publication types
MeSH terms
Substances
LinkOut - more resources
Full Text Sources
Other Literature Sources
Medical