. 2013 May 28;110(22):9090-5.
doi: 10.1073/pnas.1303858110. Epub 2013 May 14.

In vivo imaging of CD8+ T cell-mediated elimination of malaria liver stages

Affiliations

In vivo imaging of CD8+ T cell-mediated elimination of malaria liver stages

Ian A Cockburn et al. Proc Natl Acad Sci U S A. .

Abstract

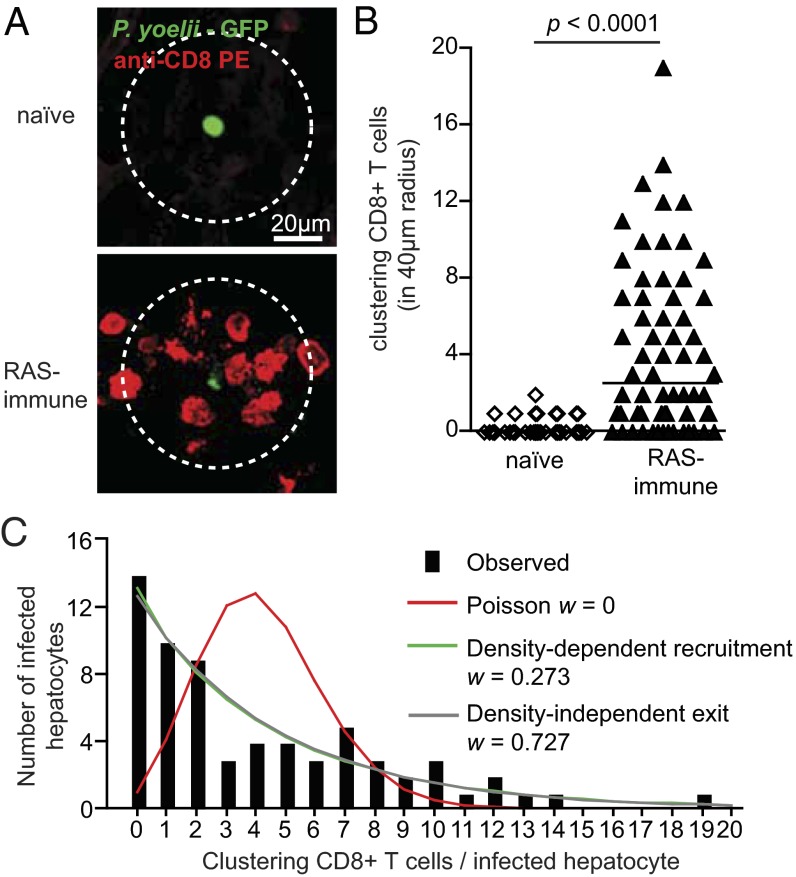
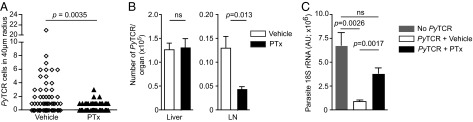
CD8(+) T cells are specialized cells of the adaptive immune system capable of finding and eliminating pathogen-infected cells. To date it has not been possible to observe the destruction of any pathogen by CD8(+) T cells in vivo. Here we demonstrate a technique for imaging the killing of liver-stage malaria parasites by CD8(+) T cells bearing a transgenic T cell receptor specific for a parasite epitope. We report several features that have not been described by in vitro analysis of the process, chiefly the formation of large clusters of effector CD8(+) T cells around infected hepatocytes. The formation of clusters requires antigen-specific CD8(+) T cells and signaling by G protein-coupled receptors, although CD8(+) T cells of unrelated specificity are also recruited to clusters. By combining mathematical modeling and data analysis, we suggest that formation of clusters is mainly driven by enhanced recruitment of T cells into larger clusters. We further show various death phenotypes of the parasite, which typically follow prolonged interactions between infected hepatocytes and CD8(+) T cells. These findings stress the need for intravital imaging for dissecting the fine mechanisms of pathogen recognition and killing by CD8(+) T cells.

Keywords: Plasmodium; immunity; lymphocytes.


Conflict of interest statement

The authors declare no conflict of interest.

Figures

Fig. 1.
Fig. 1.
Clustering of antigen-specific T cells around infected hepatocytes. (A) Representative images of parasites and CD8+ T cells in naïve or RAS immune mice inoculated with 3 × 10⁷ PyGFP parasites and imaged 24 h later after injection of 4 μg PE-conjugated anti-CD8 mAb. Images are maximal projections of 17 slices, each 3 μm apart. CD8+ T cells are defined as clustering if they lie at least partially within a circle of 40-μm radius drawn around the parasite (outer dotted circle). (B) Number of cells clustering around parasites in naïve and immune mice; lines represent median values (data are pooled from three independent experiments per group analyzed by Mann-Whitney U test). (C) The observed frequency distribution of PyTCR cells among P. yoelii-infected hepatocytes (black bars; data from A and B) compared with the distribution that would be expected according to each of three different models for cluster formation (more details are given in SI Experimental Procedures). Akaike weights (w) indicate the relative weight of how a particular model describes experimental data (among three tested models). Estimated parameters for these models and their 95% confidence intervals are given in Table S1.
Fig. 2.
Fig. 2.
Interaction of specific and nonspecific CD8+ T cells with infected hepatocytes. (A) Labeled OT-I (9 × 10⁶) or 9 × 10⁶ labeled PyTCR cells were transferred to separate mice infected 20 h previously with 3 × 10⁵ PyGFP parasites and imaged 6 h later. Images show associations between infected hepatocytes and (i) PyTCR or (ii) OT-I cells. Images are maximal Z projections of 17 slices, each 3 μm apart. (B) Proportion of infected hepatocytes surrounded by different numbers of OT-I or PyTCR cells. P values are based on χ2 test [χ2(2) = 19.6]. (C) Experiment performed as in A, except that the OT-I and PyTCR effector CD8+ T cells were transferred together. Image is a maximal Z projection of 12 slices, each 5 μm apart, showing a cluster of OT-I and PyTCR cells surrounding an infected hepatocyte. (D) Proportion of infected hepatocytes surrounded by different numbers of OT-I or PyTCR cells; data from experiment described in C. P values are based on χ2 test [χ2(2) = 1.69]. (E) Correlation of the numbers of OT-I and PyTCR cells in clusters for all infected hepatocytes measured. (F) Speed (i) and meandering indices (ii) of OT-I and PyTCR cells within clusters or outside clusters around infected hepatocytes (cells transferred together). P values are based on Mann-Whitney U test; data pooled from five movies in two independent experiments. (G) Montage of T cell dynamics around an infected hepatocyte.
Fig. 3.
Fig. 3.
Destruction of parasites by effector CD8+ T cells. PKH-26 labeled effector PyTCR cells (1 × 10⁷) were transferred to mice 20 h after infection with 3 × 10⁵ PyGFP and imaged 4–8 h later; data are pooled from 32 movies in four independent experiments. (A) Correlation of (i) entry rate and (ii) per capita exit rate of PyTCR with the total number of PyTCR cells around each infected hepatocyte. Infected hepatocytes not associated with any T cell were excluded from the analysis. (B) Graphs of ΔVI vs. VIfinal for live (white symbols) and dead (black symbols) parasites in mice that received PyTCR cells and control animals. P value is based on Fisher exact test. (C) Numbers of PyTCR cells clustering around parasites that remained alive (white symbols) and died (black symbols) averaged over time. Bars show median values; P values are based on Mann-Whitney U test. (D) Montages of representative parasites illustrating DP 1–4; images are maximal projections of 9–15 Z sections, each 5 µm apart; graphs show the change in VI over time, with symbols showing when the montage images were taken.
Fig. 4.
Fig. 4.
Treatment with PTx inhibits cluster formation and the destruction of parasites by effector CD8+ T cells. (A) Number of vehicle- or PTx-treated PyTCR cells clustering around PyGFP infected cells. Effector PyTCR cells (1 × 10⁷) were treated with 1 μg/mL PTx or vehicle alone for 1 h at 37 °C before being transferred to mice that had been challenged with 3 × 10⁵ P. yoelii sporozoites 20 h previously. Parasites were then imaged statically 6 h after PyTCR CD8+ T-cell transfer (data are pooled from two independent experiments per group and analyzed by Mann-Whitney U test). (B) PTx- and vehicle-treated cells migrate similarly to the liver: 5 × 10⁶ PyTCR cells, treated as in A, were transferred to recipient mice. Six hours later the number of PyTCR cells in perfused livers and lymph nodes was quantified by flow cytometry. (C) PTx treatment inhibits parasite elimination by PyTCR cells. PyTCR cells (5 × 10⁶) were treated either with PTx or vehicle as in A and transferred to mice that were challenged with 5 × 10³ P. yoelii. Forty-two hours later parasite burden in the liver was assessed by RT-PCR (data representative of two independent experiments).

Similar articles

Cited by

References

    1. Romero P, et al. Cloned cytotoxic T cells recognize an epitope in the circumsporozoite protein and protect against malaria. Nature. 1989;341(6240):323–326. - PubMed
    1. Trimnell A, et al. Genetically attenuated parasite vaccines induce contact-dependent CD8+ T cell killing of Plasmodium yoelii liver stage-infected hepatocytes. J Immunol. 2009;183(9):5870–5878. - PubMed
    1. Chakravarty S, Baldeviano GC, Overstreet MG, Zavala F. Effector CD8+ T lymphocytes against liver stages of Plasmodium yoelii do not require gamma interferon for antiparasite activity. Infect Immun. 2008;76(8):3628–3631. - PMC - PubMed
    1. Morrot A, Zavala F. Effector and memory CD8+ T cells as seen in immunity to malaria. Immunol Rev. 2004;201:291–303. - PubMed
    1. Mempel TR, et al. Regulatory T cells reversibly suppress cytotoxic T cell function independent of effector differentiation. Immunity. 2006;25(1):129–141. - PubMed

Publication types

MeSH terms

Substances