. 2013 May 28;110(22):9007-12.
doi: 10.1073/pnas.1220670110. Epub 2013 May 14.

Experimental interrogation of the path dependence and stochasticity of protein evolution using phage-assisted continuous evolution

Affiliations

Experimental interrogation of the path dependence and stochasticity of protein evolution using phage-assisted continuous evolution

Bryan C Dickinson et al. Proc Natl Acad Sci U S A. .

Abstract

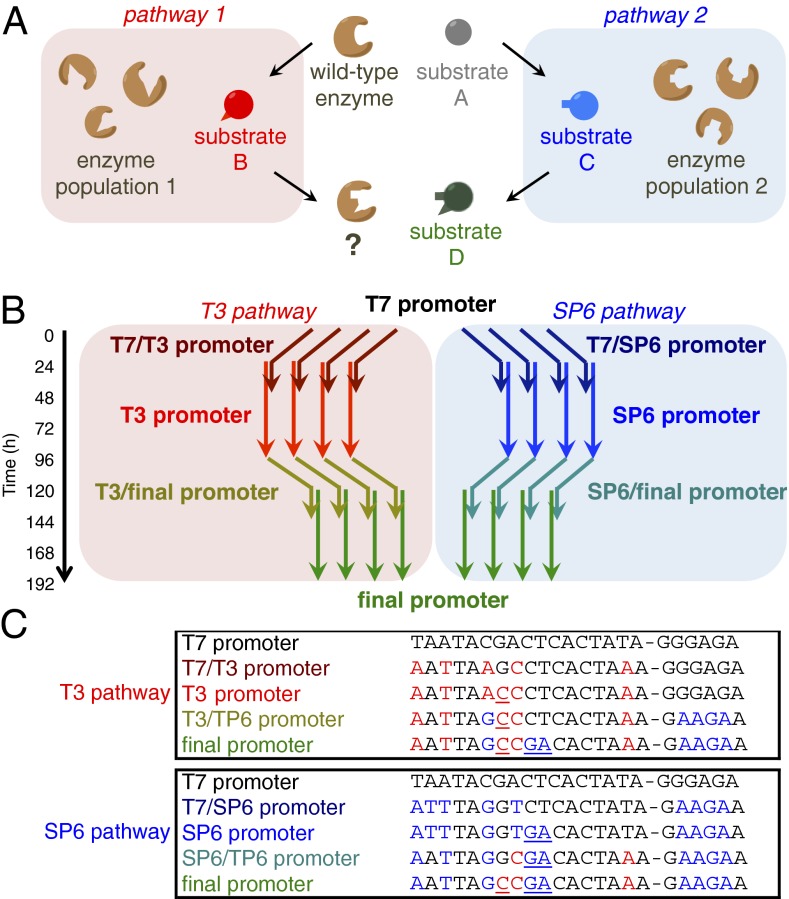
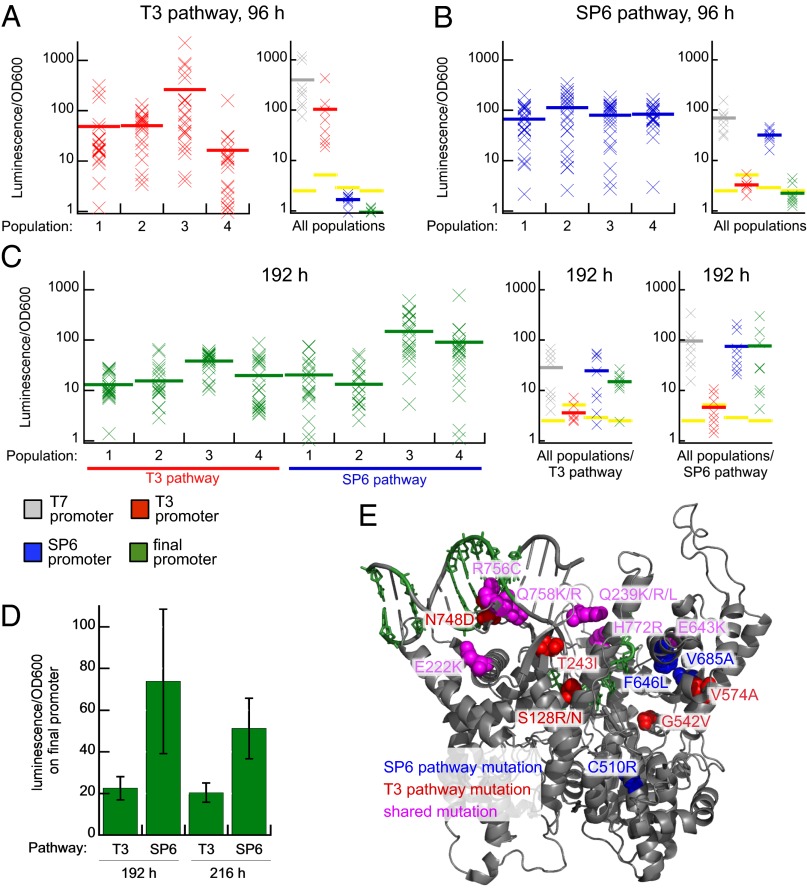
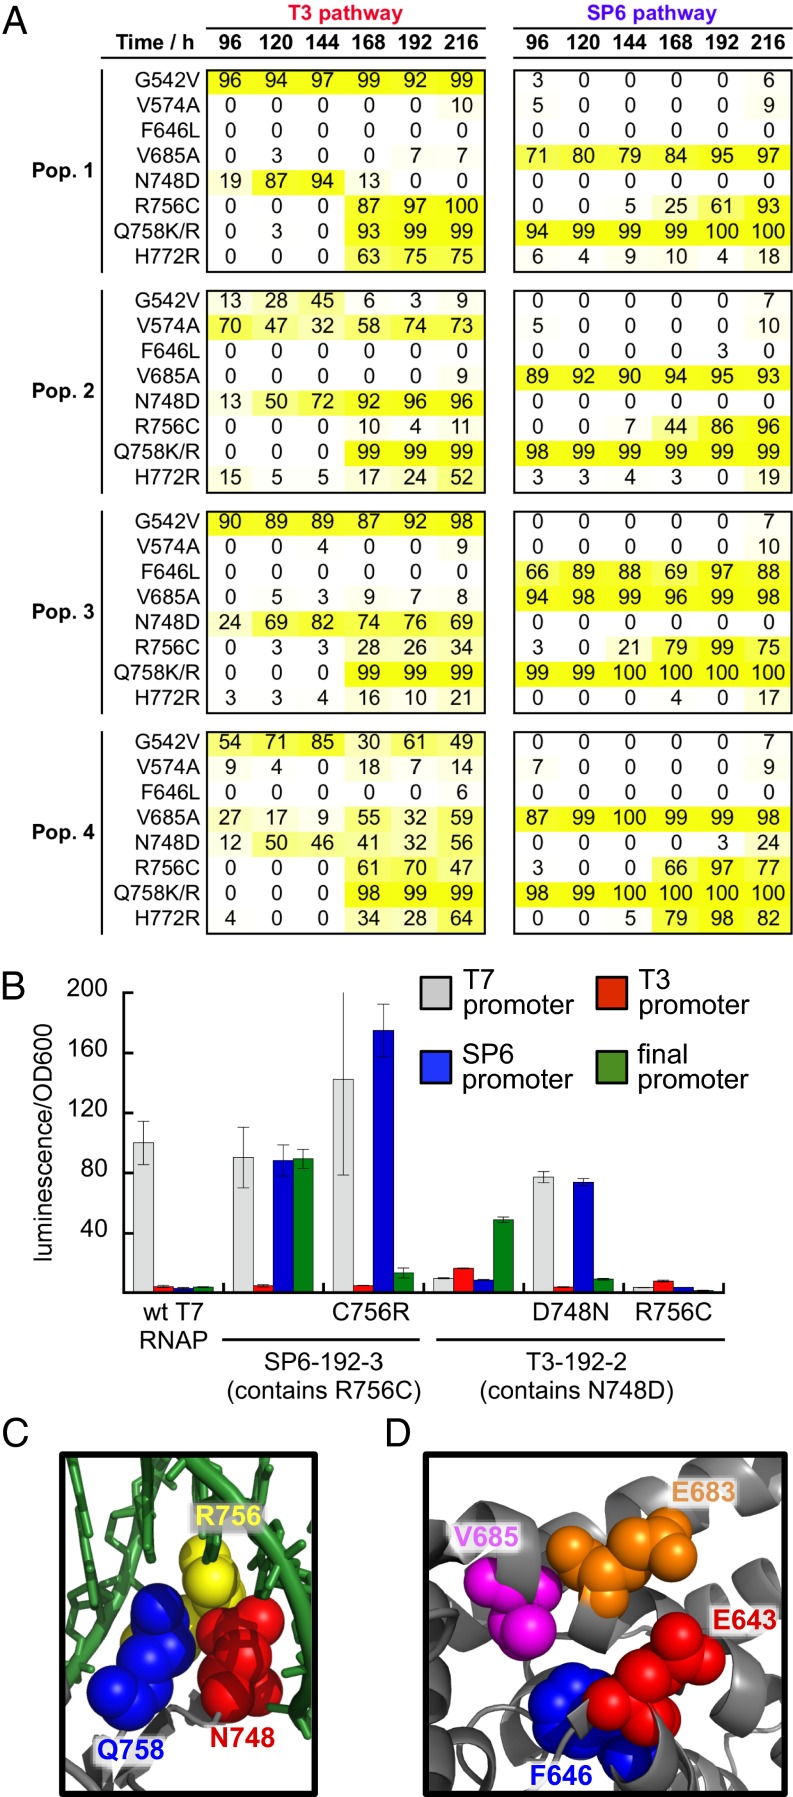
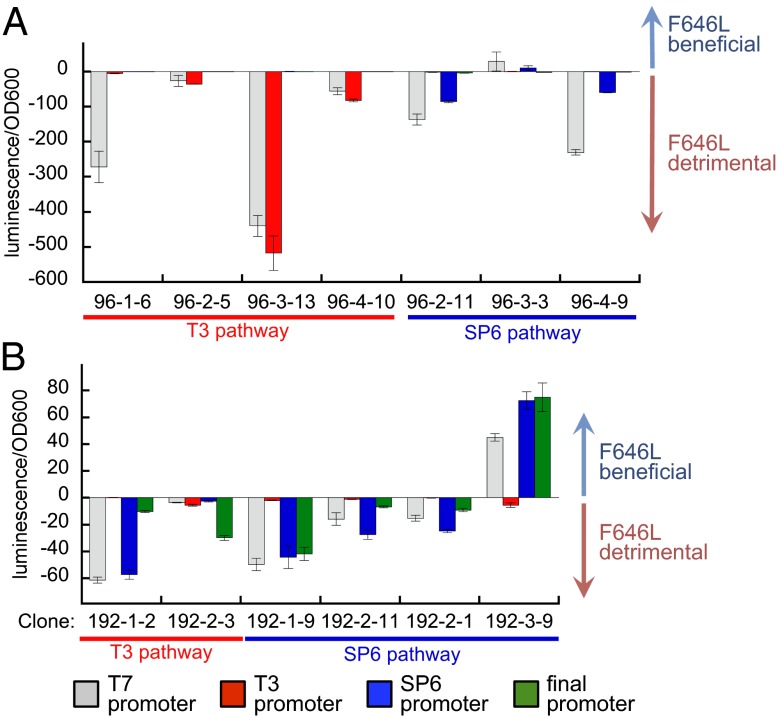
To what extent are evolutionary outcomes determined by a population's recent environment, and to what extent do they depend on historical contingency and random chance? Here we apply a unique experimental system to investigate evolutionary reproducibility and path dependence at the protein level. We combined phage-assisted continuous evolution with high-throughput sequencing to analyze evolving protein populations as they adapted to divergent and then convergent selection pressures over hundreds of generations. Independent populations of T7 RNA polymerase genes were subjected to one of two selection histories ("pathways") demanding recognition of distinct intermediate promoters followed by a common final promoter. We observed distinct classes of solutions with unequal phenotypic activity and evolutionary potential evolve from the two pathways, as well as from replicate populations exposed to identical selection conditions. Mutational analysis revealed specific epistatic interactions that explained the observed path dependence and irreproducibility. Our results reveal in molecular detail how protein adaptation to different environments, as well as stochasticity among populations evolved in the same environment, can both generate evolutionary outcomes that preclude subsequent convergence.

Keywords: directed evolution; evolutionary biology; tape of life.


Conflict of interest statement

The authors declare no conflict of interest.

Figures

Fig. 1.
Fig. 1.
Design of two evolutionary pathways. (A) Schematic overview of this study. An enzyme is guided through two separate evolutionary pathways before undergoing convergent evolution towards the same final target. (B) Independent populations of phage-encoded T7 RNAP were continuously evolved over 192 h (∼200 generations) to recognize one of two distinct intermediate promoters (T3 and SP6) followed by a common “final” promoter. Each pathway included two hybrid “stepping stone” promoters (T7/T3, T7/SP6, T3/final, and SP6/final) preceding and following each intermediate. Arrows represent times during which phage populations were fed host cells bearing the indicated promoter. Overlapping arrows represent mixtures of host cell cultures. Evolution was simultaneously performed in four replicate populations for each pathway (eight populations total). (C) Promoter sequences for each target and intermediate promoter, with changed positions from the T3 (red) or SP6 (blue) promoters colored and the transcriptional start site indicated by a dash. Critical contacts at position −11 for T3 and position −8 and −9 for SP6 promoter recognition are underlined.
Fig. 2.
Fig. 2.
Phenotypes of evolved RNA polymerases. (A) T3 promoter activity of the four populations on the T3 pathway after 96 h of continuous evolution. Each “X” represents the luciferase activity of a single randomly chosen clone on the T3 promoter luciferase reporter in E. coli cells, normalized to wild-type T7 RNAP on the T7 promoter (100%). Gray, red, blue and green bars represent the average activity of all of the assayed clones from one population and yellow bars represent the background signal with no exogenous RNA polymerase present. The activity of a subset of clones from all T3 pathway populations on the full panel of promoters is also shown (SI Appendix, Fig. S3A). (B) SP6 promoter activity of the four populations on the SP6 pathway after 96 h of continuous evolution. The activity of a subset of clones from all SP6 pathway populations on the full panel of promoters is also shown (SI Appendix, Fig. S3B). (C) Final promoter activity of all eight populations after 192 h of continuous evolution. The activity of a subset of clones from all populations on the full panel of promoters is also shown (SI Appendix, Fig. S3 C and D). (D) Average final promoter activity of each pathway at 192 and 216 h. The average final promoter activity of the four populations from each pathway is shown. Error bars represent the SE of the four populations. (E) Crystal structure of the initiation complex of T7 RNAP (25) highlighting some of the key mutations identified by HTS and reversion analysis. The green nucleotides denote positions changed in the final promoter. Red and blue residues show sites of T3-pathway and SP6-pathway mutations, respectively. PDB Structure: 1QLN.
Fig. 3.
Fig. 3.
Epistasis and stochasticity drive evolutionary outcomes. (A) The abundance of a subset of key mutations in each population (pop.) is shown during the course of the evolution from 96 to 216 h as determined by HTS. (B) Normalized luciferase activity of wild-type T7 RNAP, an evolved RNAP clone with R756C (SP6-192-3-9) (SI Appendix, Fig. S7), SP6-192-3-9 with R756C reverted, an evolved RNAP clone with N748D (T3-192-2-3) (SI Appendix, Fig. S6), T3-192-2-3 with N748D reverted, and T3-192–2-3 with the addition of R756C on luciferase reporter vectors driven by each promoter. Error bars in B reflect SE (n = 3). (C) X-ray diffraction structure of T7 RNAP bound to the T7 promoter (25) showing the proximity of N748, R756, and Q758 at the DNA-binding interface. (D) X-ray diffraction structure of T7 RNAP bound to the T7 promoter (25) showing the proximity of E643, F646, E683, and V685. PDB Structure: 1QLN.
Fig. 4.
Fig. 4.
Normalized difference in luciferase activity of evolved RNAP clones from 96 h (A) and 192 h (B) on luciferase reporter vectors driven by each promoter upon introduction of F646L. Clones are identified as timepoint-population#-clone#.

References

    1. Gould SJ. Wonderful Life: The Burgess Shale and the Nature of History. New York: WW Norton & Co; 1989.
    1. Travisano M, Mongold JA, Bennett AF, Lenski RE. Experimental tests of the roles of adaptation, chance, and history in evolution. Science. 1995;267(5194):87–90. - PubMed
    1. Barrick JE, et al. Genome evolution and adaptation in a long-term experiment with Escherichia coli. Nature. 2009;461(7268):1243–1247. - PubMed
    1. Blount ZD, Barrick JE, Davidson CJ, Lenski RE. Genomic analysis of a key innovation in an experimental Escherichia coli population. Nature. 2012;489(7417):513–518. - PMC - PubMed
    1. Toprak E, et al. Evolutionary paths to antibiotic resistance under dynamically sustained drug selection. Nat Genet. 2012;44(1):101–105. - PMC - PubMed

Publication types