. 2013 Oct;269(1):216-23.
doi: 10.1148/radiol.13121991. Epub 2013 May 14.

Improved subthalamic nucleus depiction with quantitative susceptibility mapping

Affiliations

Improved subthalamic nucleus depiction with quantitative susceptibility mapping

Tian Liu et al. Radiology. 2013 Oct.

Abstract

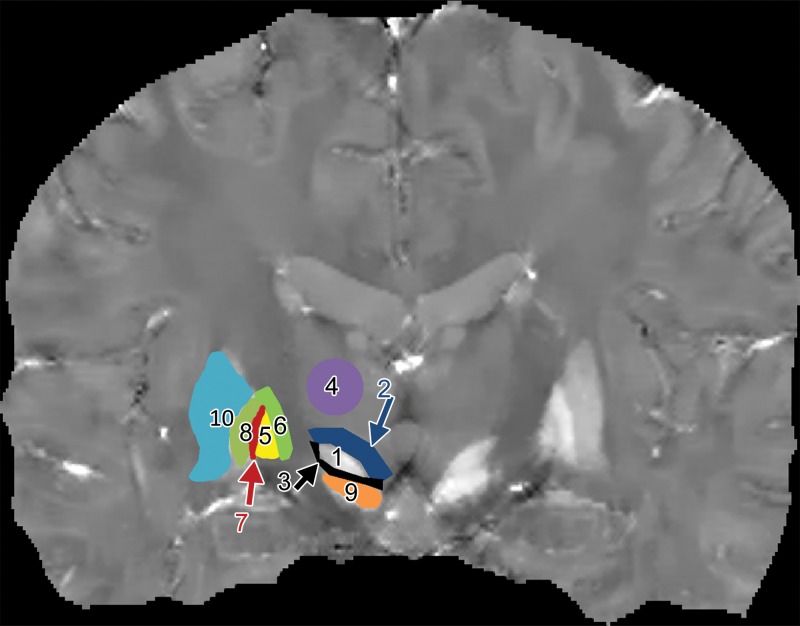
Purpose: To assess quantitative susceptibility mapping (QSM) in the depiction of the subthalamic nucleus (STN) by using 3-T magnetic resonance (MR) imaging.

Materials and methods: This study was HIPAA compliant and institutional review board approved. Ten healthy subjects (five men, five women; mean age, 24 years ± 3 [standard deviation]; age range, 21-33 years) and eight patients with Parkinson disease (five men, three women; mean age, 57 years ± 14; age range, 25-69 years) who were referred by neurologists for preoperative navigation MR imaging prior to deep brain stimulator placement were included in this study. T2-weighted (T2w), T2*-weighted (T2*w), R2* mapping (R2*), phase, susceptibility-weighted (SW), and QSM images were reconstructed for STN depiction. Qualitative visualization scores of STN and internal globus pallidus (GPi) were recorded by two neuroradiologists on all images. Contrast-to-noise ratios (CNRs) of the STN and GPi were also measured. Measurement differences were assessed by using the Wilcoxon rank sum test and the signed rank test.

Results: Qualitative scores were significantly higher on QSM images than on T2w, T2*w, R2*, phase, or SW images (P < .05) for STN and GPi visualization. Median CNR was 6.4 and 10.7 times higher on QSM images than on T2w images for differentiation of STN from the zona incerta and substantia nigra, respectively, and was 22.7 and 9.1 times higher on QSM images than on T2w images for differentiation of GPi from the internal capsule and external globus pallidus, respectively. CNR differences between QSM images and all other images were significant (P < .01).

Conclusion: QSM at 3-T MR imaging performs significantly better than current standard-of-care sequences in the depiction of the STN.


Figures

Figure 1a:
Figure 1a:
Examples of region of interest delineation in a healthy 27-year-old male volunteer. (a) Coronal QSM image shows the STN (1); its superior neighbor, presumably the ZI (2); the border between the STN and the SN (3); the thalamus (4); the GPi (5); the IC (6); the border between the GPi and the GPe, presumably the medial medullary lamina (7); and the GPe (8). Other visible anatomic regions included the SN (9) and the putamen (10). (b) Corresponding frontal sections on a Schaltenbrand and Wahren atlas along the anteroposterior axis show a section 2 mm anterior to the midcommissural point.
Figure 1b:
Figure 1b:
Examples of region of interest delineation in a healthy 27-year-old male volunteer. (a) Coronal QSM image shows the STN (1); its superior neighbor, presumably the ZI (2); the border between the STN and the SN (3); the thalamus (4); the GPi (5); the IC (6); the border between the GPi and the GPe, presumably the medial medullary lamina (7); and the GPe (8). Other visible anatomic regions included the SN (9) and the putamen (10). (b) Corresponding frontal sections on a Schaltenbrand and Wahren atlas along the anteroposterior axis show a section 2 mm anterior to the midcommissural point.
Figure 2a:
Figure 2a:
STN (outlined area) and GPi region in a healthy 25-year-old female volunteer. (a) T2w, (b) T2*w, (c) R2*, (d) phase, (e) SW, and (f) QSM images. In d and e, the STN regions were vertically interposed between hypointense line segments, and the STN region itself appeared isointense to its horizontal neighbor, IC.
Figure 2b:
Figure 2b:
STN (outlined area) and GPi region in a healthy 25-year-old female volunteer. (a) T2w, (b) T2*w, (c) R2*, (d) phase, (e) SW, and (f) QSM images. In d and e, the STN regions were vertically interposed between hypointense line segments, and the STN region itself appeared isointense to its horizontal neighbor, IC.
Figure 2c:
Figure 2c:
STN (outlined area) and GPi region in a healthy 25-year-old female volunteer. (a) T2w, (b) T2*w, (c) R2*, (d) phase, (e) SW, and (f) QSM images. In d and e, the STN regions were vertically interposed between hypointense line segments, and the STN region itself appeared isointense to its horizontal neighbor, IC.
Figure 2d:
Figure 2d:
STN (outlined area) and GPi region in a healthy 25-year-old female volunteer. (a) T2w, (b) T2*w, (c) R2*, (d) phase, (e) SW, and (f) QSM images. In d and e, the STN regions were vertically interposed between hypointense line segments, and the STN region itself appeared isointense to its horizontal neighbor, IC.
Figure 2e:
Figure 2e:
STN (outlined area) and GPi region in a healthy 25-year-old female volunteer. (a) T2w, (b) T2*w, (c) R2*, (d) phase, (e) SW, and (f) QSM images. In d and e, the STN regions were vertically interposed between hypointense line segments, and the STN region itself appeared isointense to its horizontal neighbor, IC.
Figure 2f:
Figure 2f:
STN (outlined area) and GPi region in a healthy 25-year-old female volunteer. (a) T2w, (b) T2*w, (c) R2*, (d) phase, (e) SW, and (f) QSM images. In d and e, the STN regions were vertically interposed between hypointense line segments, and the STN region itself appeared isointense to its horizontal neighbor, IC.

References

    1. Benabid AL, Chabardes S, Mitrofanis J, Pollak P. Deep brain stimulation of the subthalamic nucleus for the treatment of Parkinson’s disease. Lancet Neurol 2009;8(1):67–81 - PubMed
    1. Limousin P, Krack P, Pollak P, et al. Electrical stimulation of the subthalamic nucleus in advanced Parkinson’s disease. N Engl J Med 1998;339(16):1105–1111 - PubMed
    1. Herzog J, Fietzek U, Hamel W, et al. Most effective stimulation site in subthalamic deep brain stimulation for Parkinson’s disease. Mov Disord 2004;19(9):1050–1054 - PubMed
    1. Guehl D, Cuny E, Benazzouz A, et al. Side-effects of subthalamic stimulation in Parkinson’s disease: clinical evolution and predictive factors. Eur J Neurol 2006;13(9):963–971 - PubMed
    1. McIntyre CC, Mori S, Sherman DL, Thakor NV, Vitek JL. Electric field and stimulating influence generated by deep brain stimulation of the subthalamic nucleus. Clin Neurophysiol 2004;115(3):589–595 - PubMed

Publication types