

Kinetic Spectrofluorometric Determination of Certain Calcium Channel Blockers via Oxidation with Cerium (IV) in Pharmaceutical Preparations
- PMID: 23675129
- PMCID: PMC3614771
Kinetic Spectrofluorometric Determination of Certain Calcium Channel Blockers via Oxidation with Cerium (IV) in Pharmaceutical Preparations
Abstract
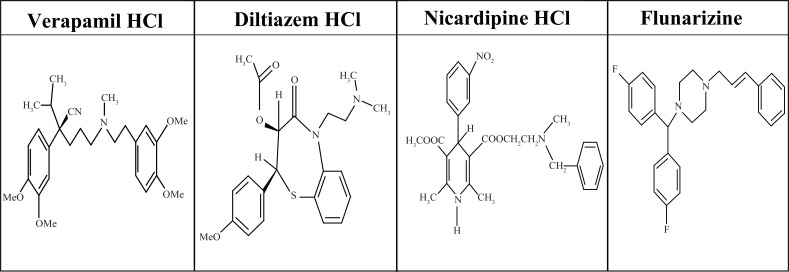
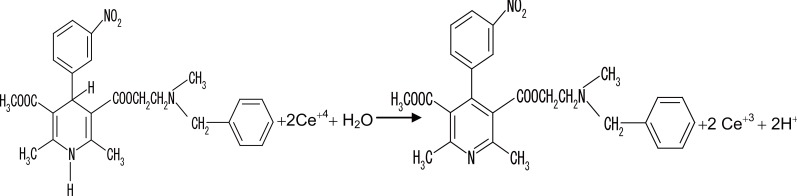
A simple and sensitive kinetic spectrofluorometric method was developed for the determination of some calcium channel blockers namely, verapamil hydrochloride, diltiazem hydrochloride, nicardipine hydrochloride and flunarizine. The method is based upon oxidation of the studied drugs with cerium (IV) ammonium sulphate in acidic medium. The fluorescence of the produced Ce (III) was measured at 365 nm after excitation at 255 nm. The different experimental parameters affecting the development and stability of the reaction product were carefully studied and optimized. The fluorescence-concentration plots were rectilinear for all the studied compounds over the concentration range of 0.01 to 0.12 μg mL(-1). The limits of detections for the studied compounds ranged from 2.93 × 10(-3) to 0.012 μg mL(-1) and limits of quantification from 9.76 × 10(-3) to 0.04 μg mL(-1) were obtained. The method was successfully applied to the analysis of commercial tablets. The results obtained were in good agreement with those obtained with reference methods.
Keywords: Cerium (IV); diltiazem hydrochloride; nicardipine hydrochloride; verapamil hydrochloride.
Figures


References
-
- Parfitt K, editor. In Martindale. The Complete Drug Reference. 32th. Massachusetts: The Pharmaceutical Press; 1999.
-
- Rahman N, Hejaz A, Syed N. Farmaco. 2004;59:529–536. - PubMed
-
- Rahman N, Hoda M. Anal. and Bioanal. Chem. 2002;374:484–489. - PubMed
-
- Khalil S, Kelzieh A. J. Pharm. Biomed. Anal. 2002;27:123–131. - PubMed
-
- Esteves da Silva JCG, Leitao JMM, Costa FS, Ribeiro JLA. Anal. Chim. Acta. 2002;453:105–115.
LinkOut - more resources
Full Text Sources