

Host resistance, population structure and the long-term persistence of bubonic plague: contributions of a modelling approach in the Malagasy focus
- PMID: 23675291
- PMCID: PMC3649974
- DOI: 10.1371/journal.pcbi.1003039
Host resistance, population structure and the long-term persistence of bubonic plague: contributions of a modelling approach in the Malagasy focus
Abstract
Although bubonic plague is an endemic zoonosis in many countries around the world, the factors responsible for the persistence of this highly virulent disease remain poorly known. Classically, the endemic persistence of plague is suspected to be due to the coexistence of plague resistant and plague susceptible rodents in natural foci, and/or to a metapopulation structure of reservoirs. Here, we test separately the effect of each of these factors on the long-term persistence of plague. We analyse the dynamics and equilibria of a model of plague propagation, consistent with plague ecology in Madagascar, a major focus where this disease is endemic since the 1920s in central highlands. By combining deterministic and stochastic analyses of this model, and including sensitivity analyses, we show that (i) endemicity is favoured by intermediate host population sizes, (ii) in large host populations, the presence of resistant rats is sufficient to explain long-term persistence of plague, and (iii) the metapopulation structure of susceptible host populations alone can also account for plague endemicity, thanks to both subdivision and the subsequent reduction in the size of subpopulations, and extinction-recolonization dynamics of the disease. In the light of these results, we suggest scenarios to explain the localized presence of plague in Madagascar.
Conflict of interest statement
The authors have declared that no competing interests exist.
Figures

 ,
, ) in black, (
 ,
, ) in dark grey and (
 ,
, ) in light grey. The dynamics for four couples of parameters are given on Supporting Figure S4.
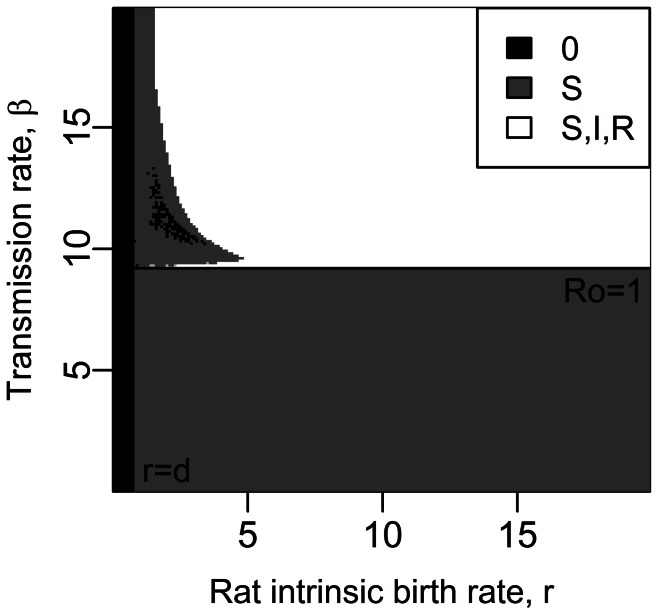
 rats. Stable equilibrium states: (
 ,
, ,
, ) in black, (
 ,
, ,
, ) in dark grey, (
 ,
, ,
, ) in light grey and (
 ,
, ,
, ) in white. The dynamics for four couples of parameters are given on Supporting Figure S8.
 rats. Other parameter values are given in Table 1. Stable equilibrium states: (
 ,
, ) in black, (
 ,
, ) in dark grey and (
 ,
, ) in light grey.
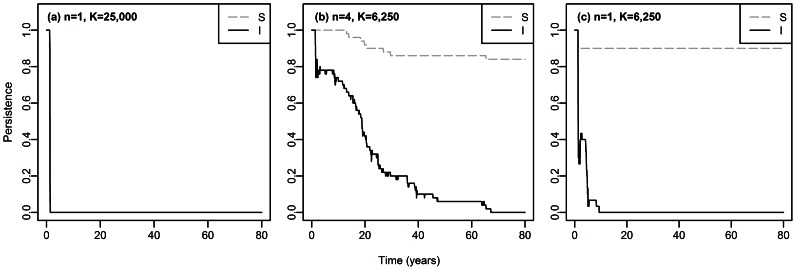
 ,
,  and other parameter values are given in Table 1. The Supporting Figure S10 illustrates, for one of the simulations in (b), the extinction-recolonization dynamics of the disease which occur between the subpopulations.
Similar articles
-
Modeling susceptible infective recovered dynamics and plague persistence in California rodent-flea communities.Vector Borne Zoonotic Dis. 2010 Jan-Feb;10(1):59-67. doi: 10.1089/vbz.2009.0048. Vector Borne Zoonotic Dis. 2010. PMID: 20158333
-
Understanding the persistence of plague foci in Madagascar.PLoS Negl Trop Dis. 2013 Nov 7;7(11):e2382. doi: 10.1371/journal.pntd.0002382. eCollection 2013 Nov. PLoS Negl Trop Dis. 2013. PMID: 24244760 Free PMC article. Review.
-
Short- and long-term humoral immune response against Yersinia pestis in plague patients, Madagascar.BMC Infect Dis. 2020 Nov 10;20(1):822. doi: 10.1186/s12879-020-05565-8. BMC Infect Dis. 2020. PMID: 33172393 Free PMC article.
-
Immune responses to plague infection in wild Rattus rattus, in Madagascar: a role in foci persistence?PLoS One. 2012;7(6):e38630. doi: 10.1371/journal.pone.0038630. Epub 2012 Jun 18. PLoS One. 2012. PMID: 22719908 Free PMC article.
-
The rise of pneumonic plague in Madagascar: current plague outbreak breaks usual seasonal mould.J Med Microbiol. 2019 Mar;68(3):292-302. doi: 10.1099/jmm.0.000915. Epub 2019 Jan 11. J Med Microbiol. 2019. PMID: 30632956 Review.
Cited by
-
A Role for Early-Phase Transmission in the Enzootic Maintenance of Plague.PLoS Pathog. 2022 Dec 15;18(12):e1010996. doi: 10.1371/journal.ppat.1010996. eCollection 2022 Dec. PLoS Pathog. 2022. PMID: 36520713 Free PMC article.
-
Comparative SIR/SEIR modeling of the Antonine Plague in Rome.PLoS One. 2025 Feb 13;20(2):e0313684. doi: 10.1371/journal.pone.0313684. eCollection 2025. PLoS One. 2025. PMID: 39946392 Free PMC article.
-
Evaluation of Yersinia pestis Transmission Pathways for Sylvatic Plague in Prairie Dog Populations in the Western U.S.Ecohealth. 2016 Jun;13(2):415-27. doi: 10.1007/s10393-016-1133-9. Epub 2016 May 27. Ecohealth. 2016. PMID: 27234457 Review.
-
Comparison of the transmission efficiency and plague progression dynamics associated with two mechanisms by which fleas transmit Yersinia pestis.PLoS Pathog. 2020 Dec 7;16(12):e1009092. doi: 10.1371/journal.ppat.1009092. eCollection 2020 Dec. PLoS Pathog. 2020. PMID: 33284863 Free PMC article.
-
Yersinia pestis: the Natural History of Plague.Clin Microbiol Rev. 2020 Dec 9;34(1):e00044-19. doi: 10.1128/CMR.00044-19. Print 2020 Dec 16. Clin Microbiol Rev. 2020. PMID: 33298527 Free PMC article. Review.
References
-
- Duplantier JM, Duchemin JB, Chanteau S, Carniel E (2005) From the recent lessons of the Malagasy foci towards a global understanding of the factors involved in plague reemergence. Vet Res 36: 437–453. - PubMed
-
- Dennis D, Gage K, Gratz N, Poland J, Tikhomirov E (1999) Plague manual: epidemiology, distribution, surveillance and control. Geneva: World Health Organization.
-
- Gage K, Kosoy M (2005) Natural history of plague: perspectives from more than a century of research. Ann Rev Entomol 50: 505–528. - PubMed
Publication types
MeSH terms
Grants and funding
LinkOut - more resources
Full Text Sources
Other Literature Sources
Medical
