. 2013 May;9(5):e1003339.
doi: 10.1371/journal.ppat.1003339. Epub 2013 May 9.

Persistently active microbial molecules prolong innate immune tolerance in vivo

Affiliations

Persistently active microbial molecules prolong innate immune tolerance in vivo

Mingfang Lu et al. PLoS Pathog. 2013 May.

Abstract

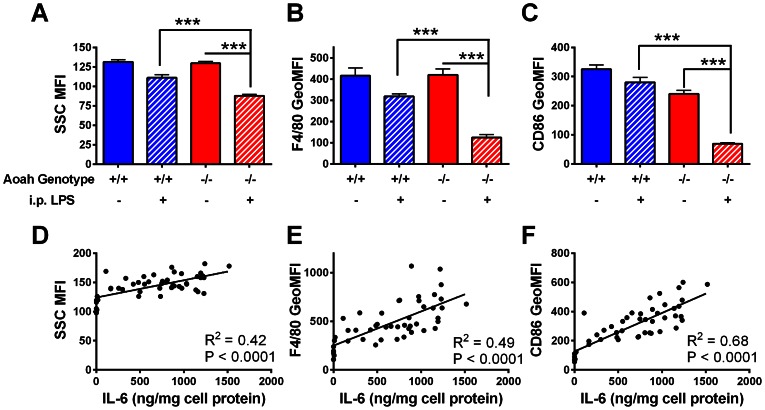
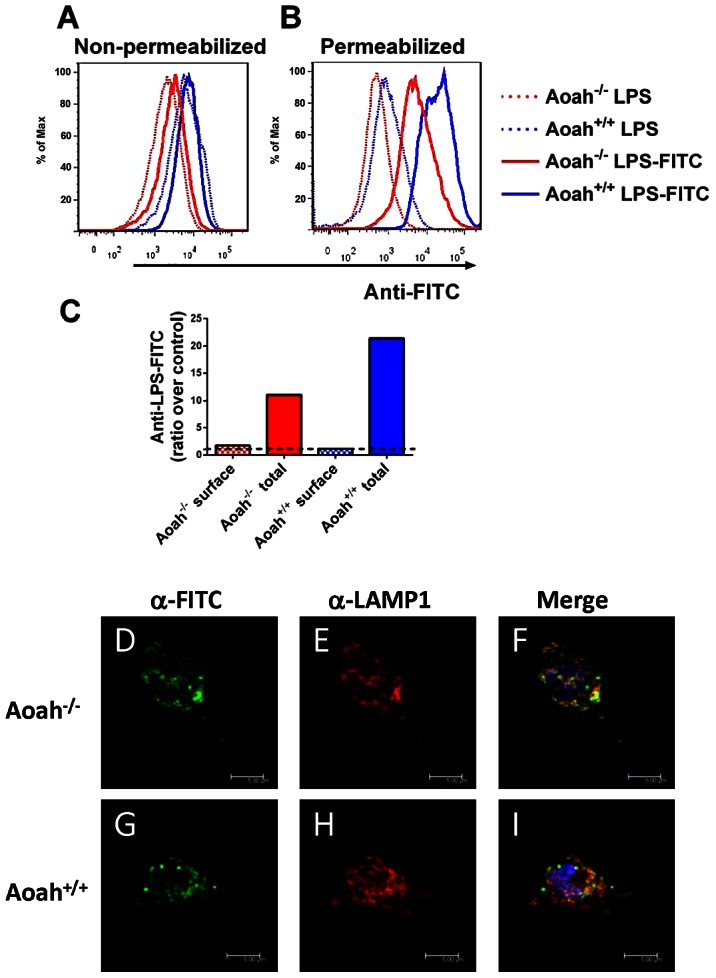
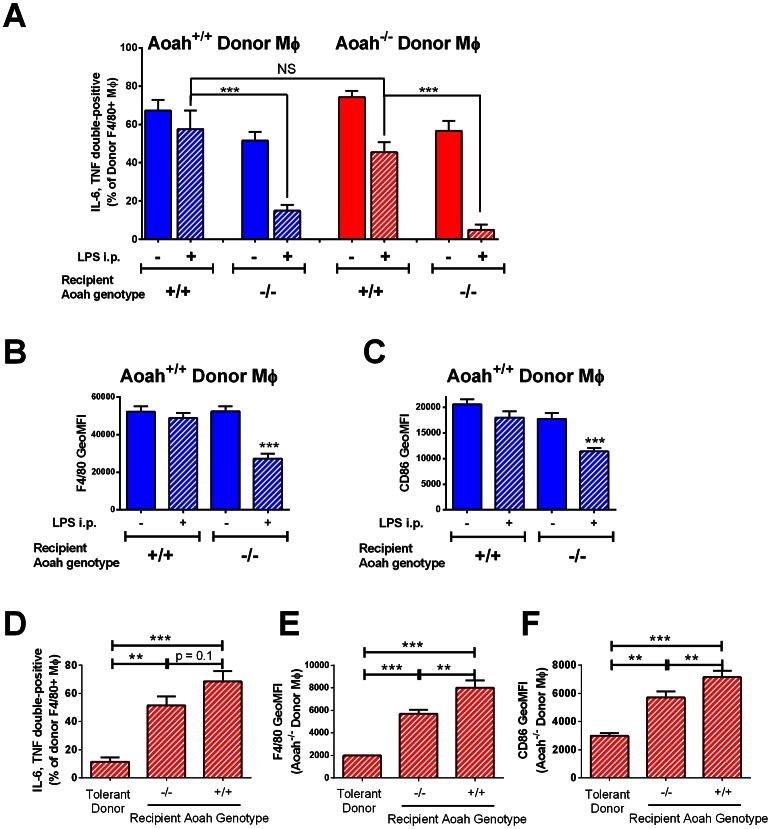
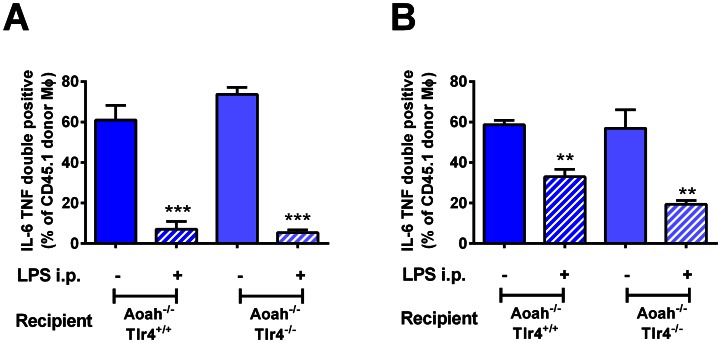
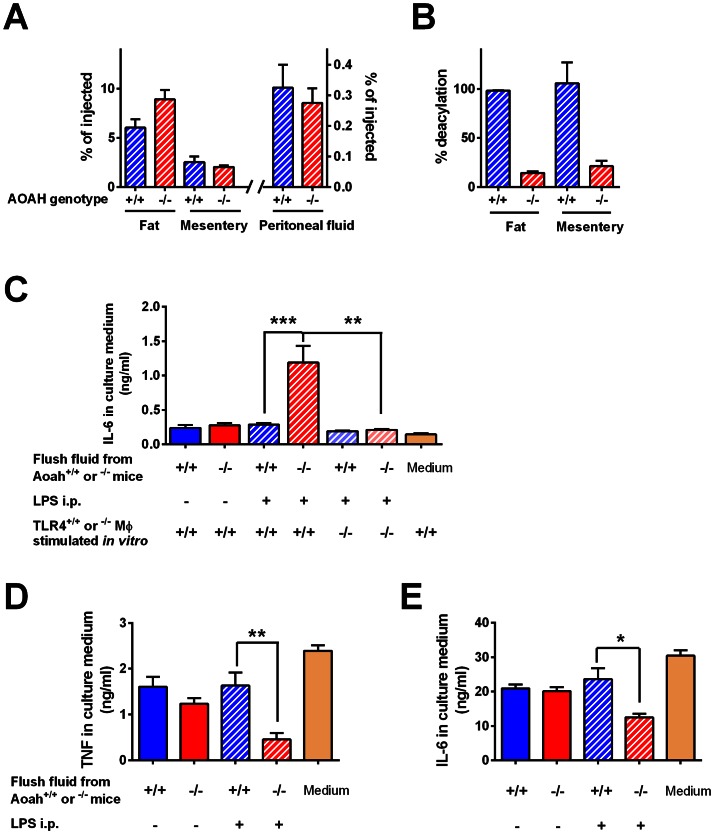
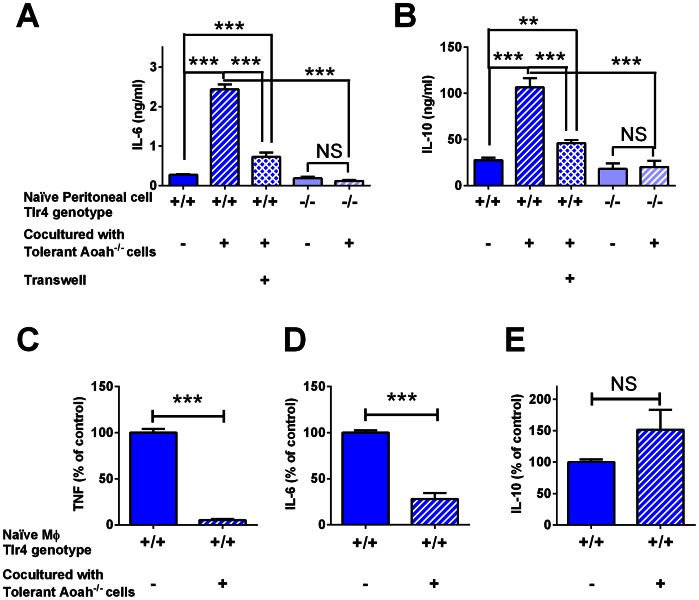
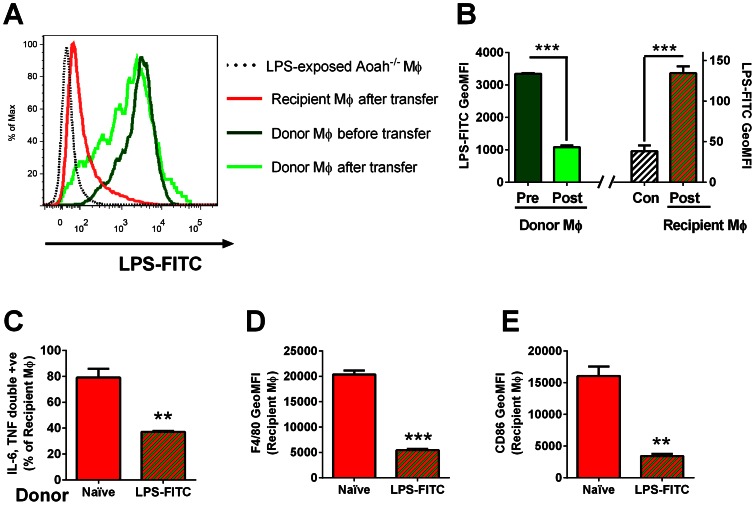
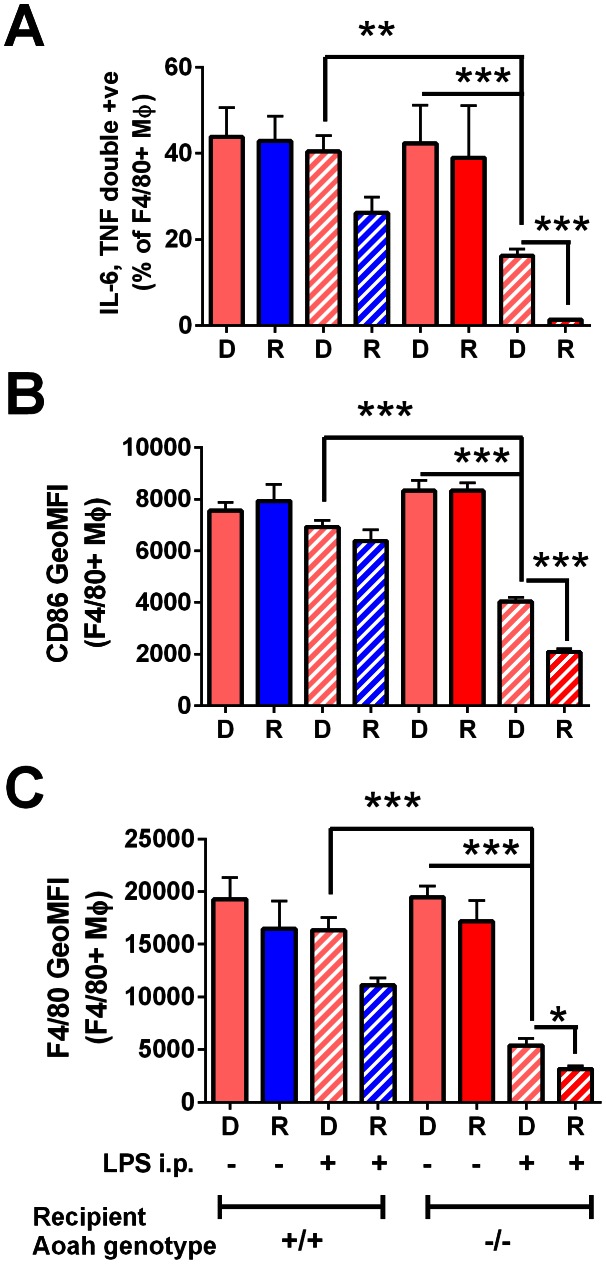
Measures that bolster the resolution phase of infectious diseases may offer new opportunities for improving outcome. Here we show that inactivation of microbial lipopolysaccharides (LPS) can be required for animals to recover from the innate immune tolerance that follows exposure to Gram-negative bacteria. When wildtype mice are exposed to small parenteral doses of LPS or Gram-negative bacteria, their macrophages become reprogrammed (tolerant) for a few days before they resume normal function. Mice that are unable to inactivate LPS, in contrast, remain tolerant for several months; during this time they respond sluggishly to Gram-negative bacterial challenge, with high mortality. We show here that prolonged macrophage reprogramming is maintained in vivo by the persistence of stimulatory LPS molecules within the cells' in vivo environment, where naïve cells can acquire LPS via cell-cell contact or from the extracellular fluid. The findings provide strong evidence that inactivation of a stimulatory microbial molecule can be required for animals to regain immune homeostasis following parenteral exposure to bacteria. Measures that disable microbial molecules might enhance resolution of tissue inflammation and help restore innate defenses in individuals recovering from many different infectious diseases.


Conflict of interest statement

The authors have declared that no competing interests exist.

Figures

Figure 1
Figure 1. Tolerant peritoneal macrophages from LPS-injected Aoah−/− mice have distinctive characteristics.
(A–C) Aoah+/+ or Aoah−/− mice were injected i.p. with PBS or 10 µg E. coli O14 LPS. Fourteen days later, their peritoneal cells were harvested; the F4/80+ cells (macrophages) were identified using flow cytometry and their SSC (A), surface expression of F4/80 (B) and CD86 (C) were measured. Data shown are from 2 independent experiments. n = 6–8. ***, p<0.001. When compared with the other groups, LPS-exposed Aoah−/− macrophages have lower SSC and express less surface F4/80 and CD86. Blue bars, Aoah+/+; Red bars, Aoah−/−; diagonal markings indicate i.p. LPS injection. (D–F) Macrophage IL-6 production following LPS re-stimulation correlates with surface marker expression. Aoah+/+ or Aoah−/− mice were injected with 0, 0.016, 0.08, 0.4, 2 or 10 µg E. coli O14 LPS i.p. Each LPS dose was given to 3–5 Aoah +/+ and Aoah−/− mice. Fourteen days later, their peritoneal cells were removed. Some were used to measure surface markers F4/80, CD86 and SSC by flow cytometry. Others were cultured for 18 hours, the floating cells were washed away and the adherent macrophages were re-stimulated with E. coli O111 LPS (1 µg/ml) for 6 hours. Medium IL-6 levels were measured by ELISA and correlated with SSC, F4/80 and CD86 expression on macrophages from the same mice. Each dot represents data from one mouse. Secreted TNF concentrations also positively correlated with these markers (Fig. S1). MFI; mean fluorescence intensity. Geo MFI; geometric mean fluorescence intensity.
Figure 2
Figure 2. Cell-associated LPS.
Aoah+/+ or Aoah−/− mice were given 10 µg LPS-FITC i.p. Ten days later, their peritoneal cells were harvested, fixed, and either permeabilized (B) or not (A). Anti-FITC Ab conjugated with Phycoerythrin (PE) was added to measure macrophage (F4/80+) surface (A) or total (B) LPS-FITC. Dotted lines, F4/80+ cells from mice that received LPS i.p. (control for autofluorescence); solid lines, F4/80+ cells from mice that were given i.p. LPS-FITC. Red lines, Aoah−/− ; blue lines, Aoah+/+. (C) The ratio of the GeoMFI of cell surface or total LPS-FITC to the GeoMFI of control macrophages. The dotted line indicates a ratio of 1.0 (no LPS-FITC association with cells). For both Aoah−/− and Aoah+/+ cells, most of the FITC was intracellular. (D–I) Mice were given 10 µg LPS-FITC i.p. Ten days after injection, peritoneal cells were harvested and cultured in plates with coverslips for 18 hours. Floating cells were washed away and adherent macrophages were fixed, permeabilized, and stained with anti-FITC Alexa fluor 488 (green), anti-LAMP1 (CD107) Ab (red) and DAPI (blue). (D and E) Aoah−/− macrophages. F, overlay of D and E. (G and H) Aoah+/+ macrophages. I, overlay of G and H. Much of the FITC-LPS was localized to LAMP1-positive vesicles in both Aoah−/− and Aoah+/+ macrophages. Scale bar = 5 µm.
Figure 3
Figure 3. The peritoneal environment confers macrophage phenotype.
(A–C) CD45.1 (or CD45.2) Aoah+/+ or Aoah−/− macrophages were transferred to Aoah+/+ or Aoah−/− recipient mice of the opposite CD45 genotype. 24 hours later, half of the mice in each group received 1 µg E. coli O14 LPS i.p. After 14 days, the peritoneal cells from the host mice were harvested. Half of the cells was treated with 1 µg/ml E. coli O111 LPS ex vivo for 4 hours in the presence of Brefeldin A. Intracellular IL-6 and TNF levels in F4/80+ donor macrophages (A) were measured using flow cytometry. Blue bars, Aoah+/+ donor macrophages; red bars, Aoah−/− donor macrophages; diagonal markings indicate LPS exposure in vivo. The other half of the cells was used to measure F4/80+ macrophage surface expression of F4/80 (B) and CD86 without ex vivo stimulation (C). In B and C, only Aoah+/+ donor macrophages were studied; they acquired the “tolerant” surface phenotype (low F4/80 and CD86 surface expression) when transferred to Aoah−/− recipients. Tolerance tracked with the genotype of the host animal, not that of the donor macrophages. Data in A were combined from 4 experiments (n = 6–13/group); data in B and C were combined from 2 experiments, n = 6–8/group. (D–F) Tolerant Aoah−/− macrophages regain responsiveness in naïve mice. CD45.1 (or CD45.2) Aoah−/− mice were injected i.p. with 0.5 µg LPS. Fourteen days later, their peritoneal cells (including tolerant macrophages) were harvested and transferred i.p. to naïve Aoah−/− or Aoah+/+ mice of the opposite CD45 type. After 7 days, peritoneal cells were harvested from the recipient mice and IL-6 and TNF responses were measured in the F4/80+ macrophages after re-challenging them with LPS ex vivo (D). F4/80 and CD86 surface expression was also measured (E and F). Only results from donor macrophages are shown. “Tolerant donor” macrophages were macrophages from Aoah−/− mice that received 0.5 µg LPS i.p. 21 days earlier and were freshly isolated (in panel D) or macrophages harvested from Aoah−/− mice that received 0.5 µg LPS i.p. 14 days earlier and were preserved in 10% DMSO, 90% FBS at −80°C until analysis (in panels E and F). Data were combined from 3 experiments. n = 6–13. **, P<0.01; ***, P<0.001. Tolerance was lost by 7 days after LPS-exposed macrophages were transferred to either naïve Aoah−/− or Aoah+/+ mice.
Figure 4
Figure 4. Bioactive LPS in the peritoneum is sufficient to maintain macrophage tolerance in vivo.
(A) CD45.1 Aoah+/+ peritoneal cells were transferred to CD45.2 Aoah−/−Tlr4+/+ or Aoah−/−Tlr4−/− mice. Half of the mice in each group received 1 µg LPS i.p. Fourteen days later, the CD45.1 donor macrophages' IL-6 and TNF responses to LPS were determined following ex vivo re-challenge. Naïve Aoah+/+ macrophages became tolerant when they were carried in LPS-injected Aoah−/− mice, whether or not the host mice expressed TLR4. n = 4–7. (B) CD45.2 Aoah−/−Tlr4+/+ or Aoah−/−Tlr4−/− mice received 1 µg LPS i.p. as indicated. Fourteen days later, CD45.1 naïve Aoah+/+ peritoneal cells were transferred i.p. to PBS- or LPS-injected mice. After 24 hours, the responses of the donor macrophages to LPS were measured ex vivo. Exposure to the LPS-containing Aoah−/− peritoneal environment rendered naïve Aoah+/+ macrophages tolerant, whether or not the host mouse was able to respond to the i.p. dose of LPS. Data were combined from 2 experiments. n = 4–6. **, P<0.01; ***, P<0.001. Blue bars, Aoah−/− Tlr4+/+ recipients; light blue bars, Aoah−/−Tlr4−/− recipients; diagonal markings represent i.p. LPS injection.
Figure 5
Figure 5. Bioactive LPS is present in the peritoneum 10 days after i.p. injection.
(A) Aoah+/+ or Aoah−/− mice were given 10 µg 3H/14C LPS i.p. Ten days later, their peritoneal cavities were flushed with 5 ml PBS that contained 5 mM EDTA and the peritoneal fat and mesentery were harvested. The amount of LPS in each specimen was determined by counting the 14C dpm in the LPS backbone. (B) The extent of deacylation was determined by measuring the 3H/14C ratio. Deacylation was not calculated in peritoneal fluid because the flush fluids contained low amounts of 14C and some free 3H- fatty acids. Blue striped bars, Aoah+/+; Red striped bars, Aoah−/−. (C) In other experiments, mice were injected i.p. with 10 µg LPS. Ten days later, the peritoneum was flushed with 2 ml cRPMI. The flush medium was centrifuged and the cell free supernatant was added to cultures of naïve Tlr4+/+ or Tlr4−/− macrophages. Eighteen hours later, the culture medium was harvested to measure IL-6. Only peritoneal flush fluid from Aoah−/− mice elicited IL-6 production by naïve TLR4-expressing macrophages. (D, E) After incubation for 18 hours, the medium containing the flush fluid was removed, the macrophages were washed twice with cRPMI, and then they were treated with 1 µg/ml LPS for 6 hours. TNF and IL-6 in the culture medium were measured. Flush fluid from LPS-exposed Aoah−/− mice induced tolerance in naïve macrophages in vitro, whereas that from LPS-exposed Aoah+/+ mice did not. Data are combined from 2 experiments. N = 6–8/group. *, P<0.05; **, P<0.01. Blue bars, Aoah+/+ peritoneal flush medium overlying TLR4+/+ cells; red bars, Aoah−/− flush medium overlying TLR4+/+ cells; light blue bars, Aoah+/+ flush medium overlying TLR4−/− cells; pink bars, Aoah−/− flush medium overlying TLR4−/− cells; diagonal markings indicate in vivo LPS exposure; orange bar, cRPMI medium overlying TLR4+/+ cells.
Figure 6
Figure 6. Co-culture with tolerant cells induces tolerance in naïve macrophages in vitro.
(A, B) Peritoneal cells from naïve Tlr4+/+ or Tlr4−/− mice were co-cultured for 18 hours at 37°C with washed peritoneal cells from Aoah−/− mice that had been injected with 10 µg LPS i.p. 10 days earlier. IL-6 and IL-10 were measured in culture medium. Only Tlr4+/+ cells co-cultured with tolerant peritoneal cells released IL-6 and IL-10. Separation of naïve Tlr4+/+ cells from LPS-exposed Aoah−/− cells in Transwell cultures significantly decreased cytokine production, suggesting that cell-cell contact is important for delivery of bioactive LPS. (C–E) In the same experiments, after incubation for 18 hours the Tlr4+/+ cells that had been co-cultured with tolerant cells were washed with cRPMI twice and then treated with 1 µg/ml LPS for 6 hours before TNF, IL-6 and IL-10 were measured in the culture medium. Naïve macrophages co-cultured with tolerant cells became reprogrammed. Blue bars, Tlr4+/+ naïve macrophages; light blue bars, Tlr4−/− naïve macrophages; diagonal markings indicate co-culture with tolerant cells; checked markings represent Transwell cultures. Data were combined from 3 experiments. n = 6–10. ***, P<0.001; NS, No significant difference.
Figure 7
Figure 7. LPS can be released from macrophages and induce tolerance in other cells in vivo.
(A) CD45.2 Aoah−/− Tlr4−/− donor mice were injected i.p. with 20 µg LPS-FITC. Seven days later, their peritoneal cells were harvested, washed and transferred to CD45.1 Aoah−/− recipient mice. After 7 days, the donor and recipient F4/80+ macrophages were analyzed by flow cytometry to measure the amount of cell-associated LPS-FITC. Dark green, donor macrophages before transfer; light green, donor macrophages recovered 7 days after transfer; red, recipient peritoneal macrophages 7 days after transfer; Dotted black, LPS (unlabeled)-exposed Aoah−/− macrophages (autofluorescence control). (B) Geometric mean fluorescence intensity (GeoMFI) of cells in (A). (C–E) Naïve recipient macrophages become tolerant after exposure in vivo to donor macrophages that contain LPS-FITC. CD45.2 Aoah−/− Tlr4−/− macrophages, either naïve or containing LPS-FITC, were transferred to naïve CD45.1 Aoah−/− mice as described in (A). Seven days after transfer, peritoneal cells were harvested from the recipient mice and half of the cells were re-challenged ex vivo with 1 µg/ml LPS in the presence of Brefeldin A. Intracellular IL-6 and TNF was measured in CD45.1 recipient macrophages (F4/80+) (C). Recipient macrophage surface F4/80 (D) and CD86 (E) were measured in cells that were not re-stimulated ex vivo. TLR4-deficient donor cells bearing LPS-FITC induced tolerance in recipient macrophages in vivo. Similar results were obtained in 2 additional experiments, each with n = 3. **, P<0.01; ***, P<0.001.
Figure 8
Figure 8. Aoah−/−Tlr4−/− macrophages can become tolerant in LPS-injected Aoah−/− mice.
(A) CD45.2 Aoah−/−Tlr4−/− naïve peritoneal cells were transferred to the peritoneal cavities of CD45.1 Aoah+/+Tlr4+/+ and Aoah−/−Tlr4+/+ mice. After 18 hours, half of the recipient mice in each group were injected i.p. with 1 µg LPS. Fourteen days after injection, the peritoneal cells were harvested. Some of the cells were treated ex vivo with 40 µg/ml Micrococcus luteus plus 2.5 µg/ml poly I:C for 8 hours in the presence of Brefeldin A. IL-6 and TNF production by donor (D) and recipient (R) F4/80+ macrophages was measured using flow cytometry. (B and C) The remainder of the peritoneal cells was not re-stimulated ex vivo and was used to determine surface expression of F4/80 and CD86 on macrophages (F4/80+) by flow cytometry. **, P<0.01; ***, P<0.001. Data were combined from 2 independent experiments. n = 5–7. Aoah−/− Tlr4−/− macrophages, which are unable to respond to LPS, became tolerant to TLR2 and TLR3 ligands (A) and developed the tolerant surface phenotype (B and C) when they were transferred into LPS-primed Aoah−/− mice, supporting a role for non-LPS stimuli in promoting tolerance in vivo. Pink bars, Aoah−/−Tlr4−/− donor macrophages; Blue bars, Aoah+/+ recipient macrophages; red bars, Aoah−/− recipient macrophages; diagonal markings indicate in vivo LPS exposure.
Figure 9
Figure 9. rhAOAH prevents prolonged endotoxin tolerance in vivo.
Aoah−/− mice were injected with 1 µg LPS i.p. on day 0. From days 1 to 13, mice were given daily i.p. doses of 0.3 µg rhAOAH or placebo (carrier protein BSA in PBS) (diagonal marking red bars). Peritoneal cells were explanted on day 14 and the adherent macrophages were challenged ex vivo with LPS for 6 hrs before medium cytokine levels were measured. (A), IL-6; (B), TNF; (C), RANTES. Naïve Aoah−/− peritoneal macrophages were used as controls (solid red bars). **, P<0.01; ***, P<0.001. rhAOAH largely prevented prolonged tolerance in vivo.

Similar articles

Cited by

References

    1. Cohn ZA (1963) The fate of bacteria within phagocytic cells. I. The degradation of isotopically labeled bacteria by polymorphonuclear leucocytes and macrophages. J Exp Med 117: 27–42. - PMC - PubMed
    1. Elsbach P (1973) On the Interaction Between Phagocytes and Micro-organisms. N Engl J Med 289: 846–852. - PubMed
    1. Elsbach P (1980) Degradation of Microorganisms by Phagocytic Cells. Rev Infect Dis 2: 106–128. - PubMed
    1. Humann J, Lenz LL (2009) Bacterial peptidoglycan degrading enzymes and their impact on host muropeptide detection. J Innate Immun 1: 88–97. - PMC - PubMed
    1. Wang H, Gupta D, Li X, Dziarski R (2005) Peptidoglycan recognition protein 2 (N-acetylmuramoyl-L-Ala amidase) is induced in keratinocytes by bacteria through the p38 kinase pathway. Infect Immun 73: 7216–7225. - PMC - PubMed

Publication types

MeSH terms