. 2013 May;9(5):e1003357.
doi: 10.1371/journal.ppat.1003357. Epub 2013 May 9.

LAB/NTAL facilitates fungal/PAMP-induced IL-12 and IFN-γ production by repressing β-catenin activation in dendritic cells

Affiliations

LAB/NTAL facilitates fungal/PAMP-induced IL-12 and IFN-γ production by repressing β-catenin activation in dendritic cells

Selinda J Orr et al. PLoS Pathog. 2013 May.

Abstract

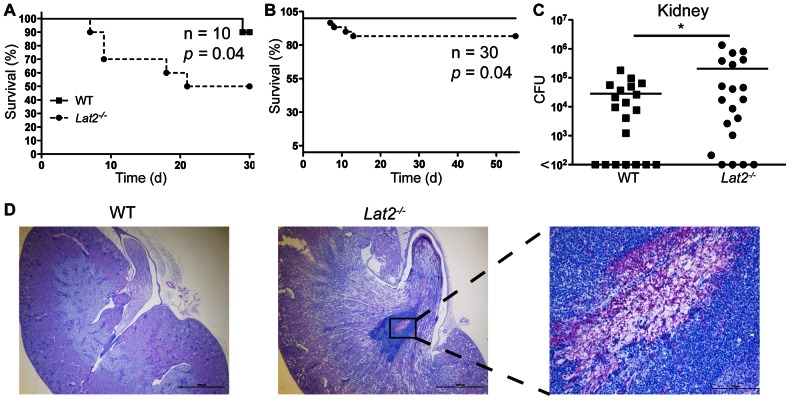
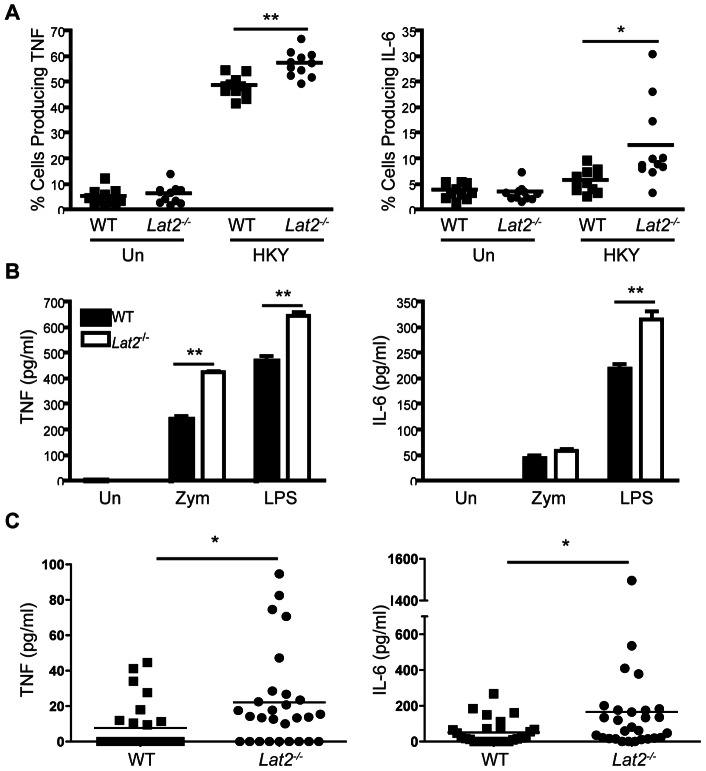
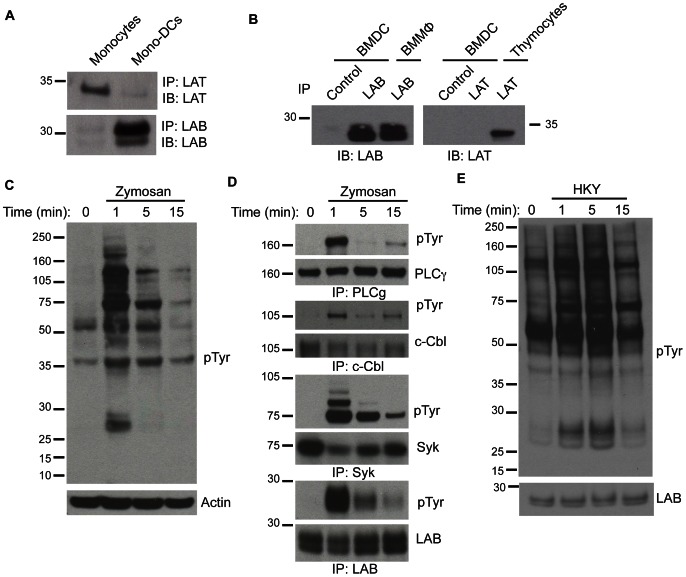
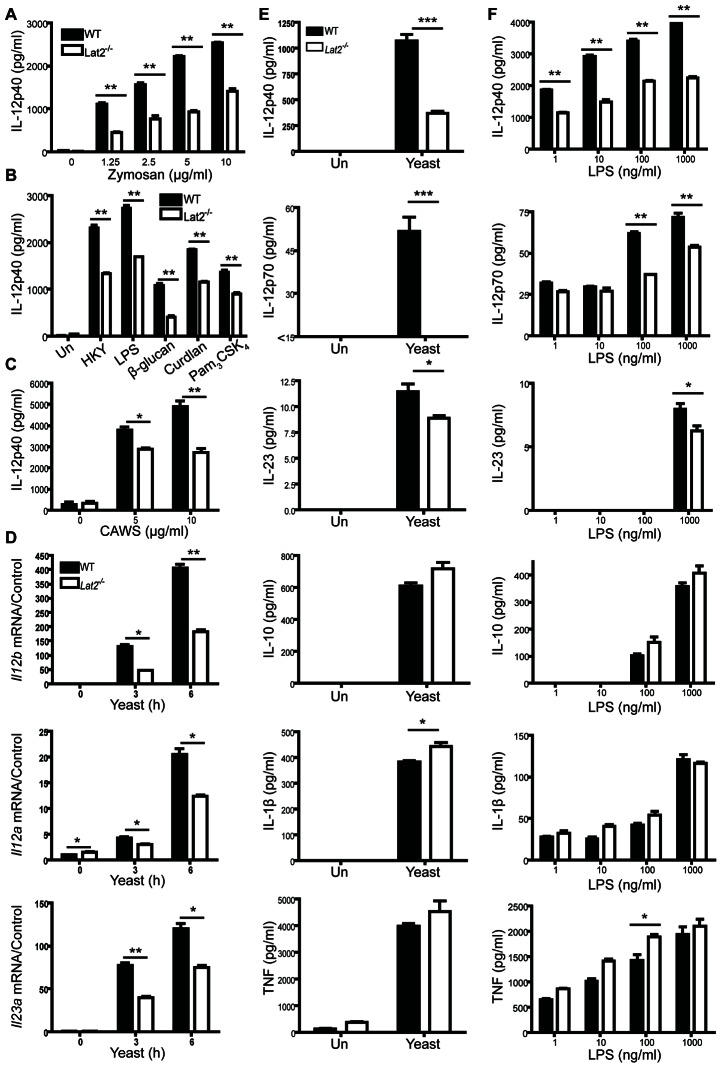
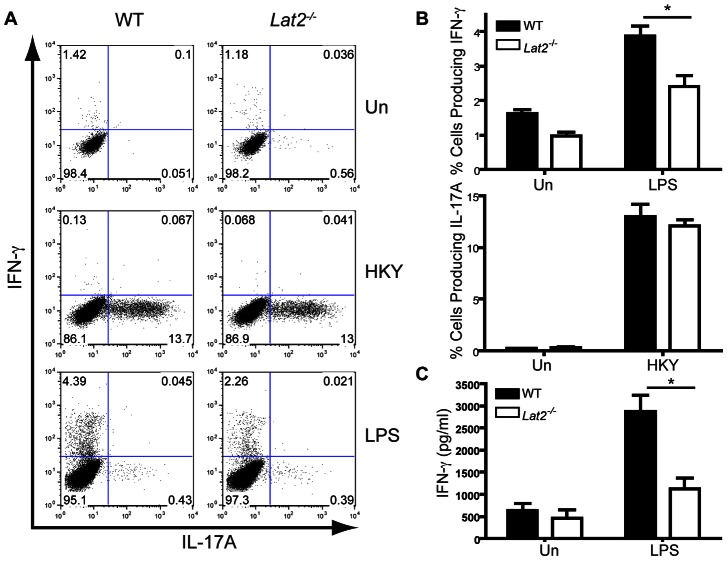
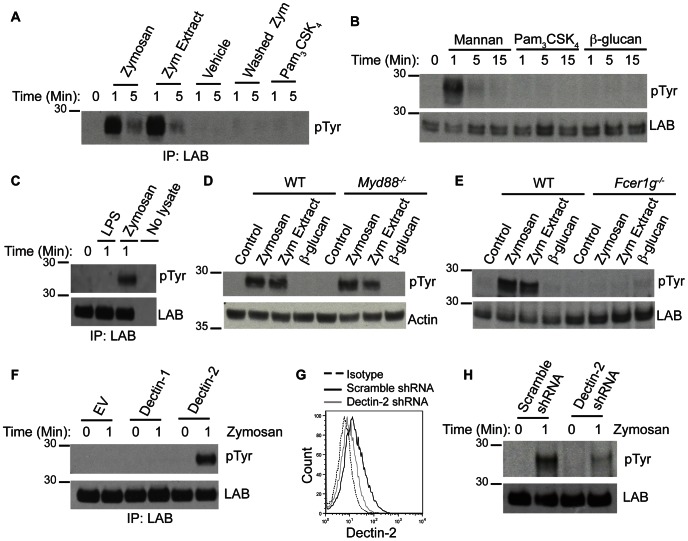
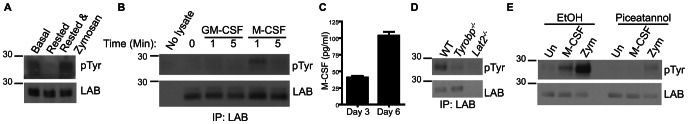
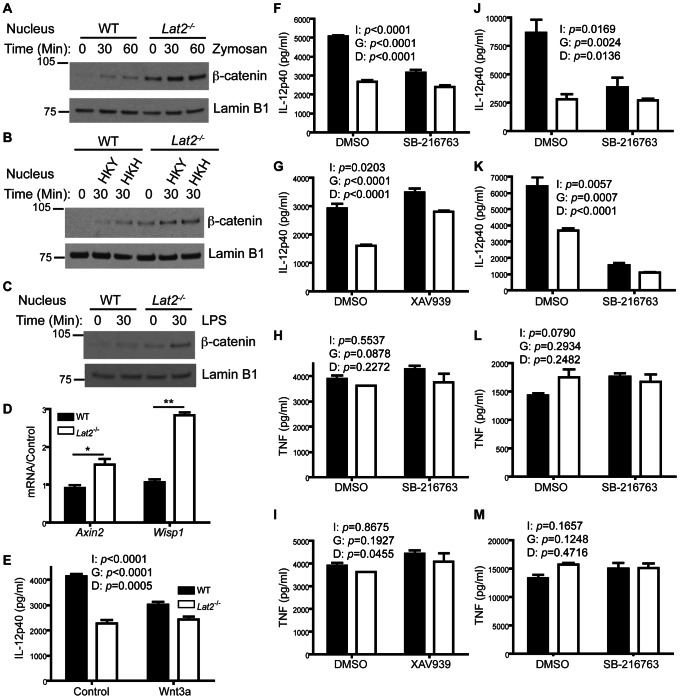
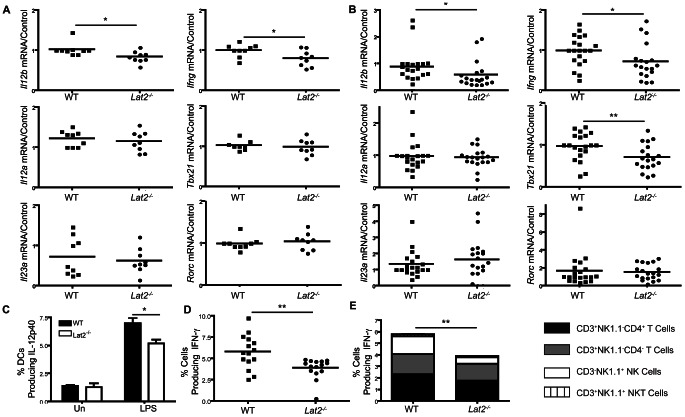
Fungal pathogens elicit cytokine responses downstream of immunoreceptor tyrosine-based activation motif (ITAM)-coupled or hemiITAM-containing receptors and TLRs. The Linker for Activation of B cells/Non-T cell Activating Linker (LAB/NTAL) encoded by Lat2, is a known regulator of ITAM-coupled receptors and TLR-associated cytokine responses. Here we demonstrate that LAB is involved in anti-fungal immunity. We show that Lat2-/- mice are more susceptible to C. albicans infection than wild type (WT) mice. Dendritic cells (DCs) express LAB and we show that it is basally phosphorylated by the growth factor M-CSF or following engagement of Dectin-2, but not Dectin-1. Our data revealed a unique mechanism whereby LAB controls basal and fungal/pathogen-associated molecular patterns (PAMP)-induced nuclear β-catenin levels. This in turn is important for controlling fungal/PAMP-induced cytokine production in DCs. C. albicans- and LPS-induced IL-12 and IL-23 production was blunted in Lat2-/- DCs. Accordingly, Lat2-/- DCs directed reduced Th1 polarization in vitro and Lat2-/- mice displayed reduced Natural Killer (NK) and T cell-mediated IFN-γ production in vivo/ex vivo. Thus our data define a novel link between LAB and β-catenin nuclear accumulation in DCs that facilitates IFN-γ responses during anti-fungal immunity. In addition, these findings are likely to be relevant to other infectious diseases that require IL-12 family cytokines and an IFN-γ response for pathogen clearance.


Conflict of interest statement

The authors have declared that no competing interests exist.

Figures

Figure 1
Figure 1. Lat2−/− mice display increased susceptibility to C. albicans.
Survival curves of WT (filled squares) and Lat2−/− mice (filled circles) infected intravenously with (A) 1.5×10⁵ CFU or (B) 5×10⁴ CFU C. albicans SC5314. (A) Graph is representative of 3 independent experiments. p = 0.04 (log-rank test), n = 10. (B) Graph is the cumulative result of 3 independent experiments. p = 0.04 (log-rank test), n = 30. (C) CFU in the kidneys at 9 days after infection with 1.5×10⁵ CFU C. albicans. Graph is the cumulative result of 4 independent experiments. *p<0.05 (Student's t test on transformed data). Each symbol represents an individual mouse. (D) Fungal growth in a representative WT (left panel (2× magnification)) or Lat2−/− (middle panel (2x) and enlargement of boxed area, right panel (20x)) kidney at time of death (Lat2−/−) or 55 days (WT) after i.v. infection with 5×10⁴ CFU C. albicans. Kidney sections were stained with Periodic Acid Schiff.
Figure 2
Figure 2. Lat2−/− neutrophil cytokine responses are not impaired.
(A) Peritoneal neutrophils (from 4 h intraperitoneal infection with 1×10⁵ CFU C. albicans) were re-stimulated with/without heat-killed C. albicans yeast. TNF and IL-6 levels were analyzed by flow cytometry. Graph is the cumulative result of 2 independent experiments. Each symbol represents an individual mouse. *p<0.05 **p<0.005 (1-way ANOVA, Bonferroni's post-test) (B) Purified bone marrow neutrophils were stimulated with 10 µg/ml zymosan or 100 ng/ml LPS. TNF and IL-6 levels in the supernatants from three replicates were measured after 24 h. Data are representative of 2 independent experiments. **p<0.005 (1-way ANOVA, Bonferroni's post-test) (C) TNF and IL-6 levels were measured in the serum of WT (filled squares) and Lat2−/− mice (filled circles) at time of death or 30 days after i.v. infection with 1.5×10⁵ CFU C. albicans SC5314. Graph is the cumulative result of 3 independent experiments. Each symbol represents an individual mouse. *p<0.05 (TNF - Mann Whitney test; IL-6 - Student's t test on transformed data).
Figure 3
Figure 3. LAB expression in DCs and involvement in zymosan and C. albicans signaling.
(A & B) Human (A) and mouse (B) cells were immunoprecipitated with anti-LAT and anti-LAB, resolved via SDS-PAGE and immunoblotted with anti-LAT and anti-LAB. (C–E) BMDCs were stimulated with 1 mg/ml zymosan (C–D) or 1×10⁷ heat-killed C. albicans yeast (E) for the indicated times and (C) whole cell lysates (WCL) were resolved via SDS-PAGE and immunoblotted with anti-phosphotyrosine and reprobed with anti-Actin. (D) Cells were immunoprecipitated with anti-PLCγ2, anti-c-Cbl, anti-Syk or anti-LAB and immunoblotted with anti-phosphotyrosine, anti-PLCγ2, anti-c-Cbl, anti-Syk or anti-LAB. (E) WCL were immunoblotted with anti-phosphotyrosine and anti-LAB. Data are representative of 2–3 independent experiments.
Figure 4
Figure 4. LAB facilitates PAMP/fungal-induced production of IL-12 and IL-23 by BMDCs.
(A–C) BMDCs from WT and Lat2 −/− mice were stimulated with (A) zymosan or (B) 1×10⁵ HKY, 100 ng/ml LPS, 5 µg/ml particulate β–glucan, 10 µg/ml Curdlan, 20 ng/ml Pam3CSK4 or (C) 5–10 µg/ml CAWS (mannans). Cytokine levels in the supernatants were measured after 24 h incubation (B) or 48 h incubation (C). (D) BMDCs from WT and Lat2 −/− mice were stimulated for the indicated times with 1×10⁵ live C. albicans yeast. RNA was isolated, cDNA was prepared and Il12b, Il12a and Il23a mRNA transcripts were detected by real-time qPCR. mRNA levels were normalized to Hprt1. Black bars represent WT, white bars represent Lat2 −/−. (E) BMDCs from WT and Lat2 −/− mice were stimulated for the indicated times with live C. albicans yeast. Fungizone was added 2 h later and cytokine levels in the supernatants were measured after 24 h incubation. (F) BMDCs from WT and Lat2 −/− mice were stimulated with 1–1000 ng/ml LPS. Cytokine levels in the supernatants were measured after 24 h incubation. For all graphical data, results are presented as means +/− s.e.m. of three replicates and data are representative of 2–4 independent experiments. *p<0.05 **p<0.005 ***p<0.0005 (1-way ANOVA, Bonferroni's post-test or Student's t test).
Figure 5
Figure 5. LAB is required for efficient Th1 responses.
(A–C) Purified wild-type naïve CD4+ T cells were stimulated with anti-CD3 and anti-CD28 for 4 days in the presence of conditioned medium from BMDCs cultured with 1×10⁵ heat-killed C. albicans yeast or 1 µg/ml LPS. (A–B) The cells were restimulated with PMA and Ionomycin and IFN-γ and IL-17A levels were analyzed by flow cytometry. Flow plots are representative of three replicates. (B) Graphs display mean +/− s.e.m. % cells expressing IFN-γ or IL-17A from three replicates analyzed by flow cytometry. Black bars represent WT, white bars represent Lat2 −/−. (C) IFN-γ levels in the supernatants from three replicates were measured after 4 days. Data are representative of 3 independent experiments. *p<0.05 (1-way ANOVA, Bonferroni's post-test).
Figure 6
Figure 6. Mannan-Dectin-2 signaling stimulates LAB phosphorylation.
(A) BMDCs were stimulated with 1 mg/ml zymosan, zymosan extract, vehicle control, washed zymosan or Pam3CSK4 for the indicated times and cells were immunoprecipitated with anti-LAB and immunoblotted with anti-phosphotyrosine. (B) BMDCs were stimulated with 1 mg/ml mannan, particulate β-glucan or Pam3CSK4 for the indicated times and WCL were immunoblotted with anti-phosphotyrosine and anti-LAB. (C) BMDCs were stimulated with 10 µg/ml LPS or 1 mg/ml zymosan for the indicated times and WCL were immunoprecipitated with anti-LAB and immunoblotted with anti-phosphotyrosine and anti-LAB. (D & E) BMDCs from WT, Myd88−/− (D) and Fcer1g−/− (E) mice were stimulated for 1 min with 1 mg/ml zymosan, zymosan extract or particulate β-glucan. WCL were immunoblotted with anti-phosphotyrosine and anti-Actin or anti-LAB. (F) RAW-264 cell lines expressing Empty Vector (EV), Dectin-1 or Dectin-2 were stimulated with 1 mg/ml zymosan. Cells were immunoprecipitated with anti-LAB and immunoblotted with anti-LAB and anti-phosphotyrosine. (G–H) BMDCs were infected with scrambled shRNA control or Dectin-2 shRNA. (G) BMDCs were stained for surface expression of Dectin-2 and analyzed by flow cytometry. (H) BMDCs were stimulated with 1 mg/ml zymosan and WCL were immunoblotted with anti-phosphotyrosine and anti-LAB.
Figure 7
Figure 7. MCSF/DAP12 signaling stimulates LAB phosphorylation.
(A) BMDCs from WT mice were lysed immediately without resting or rested for 30 min in serum free media +/− stimulation with 1 mg/ml zymosan for 1 min. WCL were immunoblotted with anti-LAB and anti-phosphotyrosine. (B) BMDCs from WT mice were stimulated for the indicated times with 100 ng/ml GM-CSF and M-CSF. WCL were immunoprecipitated with anti-LAB and immunoblotted with anti-phosphotyrosine and anti-LAB. (C) M-CSF levels in supernatants from WT BMDC cultures at Days 3 and 6 were measured. (D) BMDCs from WT, Tyrobp−/− and Lat2−/− mice were lysed immediately without resting. WCL were immunoprecipitated with anti-LAB and immunoblotted with anti-phosphotyrosine and anti-LAB. (E) WT BMDCs were rested for 30 min, treated with 30 µg/ml Piceatannol or EtOH for 30 min prior to stimulation with 100 ng/ml M-CSF or 1 mg/ml zymosan for 1 min. WCL were immunoblotted with anti-phosphotyrosine and anti-LAB. Data are representative of 2 independent experiments.
Figure 8
Figure 8. LAB facilitates fungal-induced cytokine production by controlling β-catenin activation.
(A–C) BMDCs from WT and Lat2 −/− mice were stimulated for the indicated times with (A) 1 mg/ml zymosan, (B) 1×10⁷ heat-killed C. albicans yeast or hyphae or (C) 10 ng/ml LPS. Nuclear fractions were immunoblotted with anti-β-catenin and reprobed with anti-Lamin B1. (D) RNA was isolated from WT and Lat2 −/− BMDCs, cDNA was prepared and Axin2 and Wisp1 mRNA transcripts were detected by real-time qPCR. mRNA levels were normalized to Hprt1. Black bars represent WT, white bars represent Lat2 −/−. *p<0.05 **p<0.005 (1-way ANOVA, Bonferroni's post-test) (E) BMDCs from WT and Lat2 −/− mice were treated with Vehicle Control or 100 ng/ml Wnt3a for 24 h prior to stimulation with heat-killed C. albicans yeast. Cytokine levels in the supernatants were measured after 24 h incubation. (F–I) BMDCs from WT and Lat2 −/− mice were stimulated with heat-killed C. albicans yeast in the presence of DMSO, SB-216763 or XAV939. Cytokine levels in the supernatants were measured after 24 h incubation. (J–M) BMDCs from WT and Lat2 −/− mice were stimulated with LPS (J&L), or WGP (K&M) in the presence of DMSO or SB-216763. Cytokine levels in the supernatants were measured after 24 h incubation (J–M). (E–M) A 2 way ANOVA was used for statistical analysis to examine for significant effects of the Genotype (G) and Drug (D) as well as an Interaction (I) between these two factors. For all graphical data, results are presented as means +/− s.e.m. of three replicates and data are representative of at least 2 independent experiments.
Figure 9
Figure 9. Lat2−/− mice display decreased DC and NK, T and NKT cell-mediated cytokine levels.
(A–B) RNA was isolated from the spleens of (A) naïve WT and Lat2 −/− mice and (B) WT and Lat2 −/− mice 9 days after infection with 1.5×10⁵ CFU C. albicans, cDNA was prepared and mRNA transcripts were detected by real-time qPCR. mRNA levels were normalized to Hprt1. Graphs are the cumulative result of 3–4 independent experiments. *p<0.05 **p<0.005 (Student's t test). (B) Il12b data was transformed for analysis. (C) WT and Lat2−/− spleen cells were stimulated with LPS for 6 h. IL-12p40 levels in CD11c+MHCII+ DCs were analyzed by flow cytometry. Graph displays mean +/− s.e.m. % DCs expressing IL-12p40 from four mice analyzed by flow cytometry. Black bars represent WT, white bars represent Lat2 −/−. Data are representative of 2 independent experiments. *p<0.05 (1-way ANOVA, Bonferroni's post-test). (D–E) Peritoneal lavage cells from WT and Lat2−/− mice 72 h after intraperitoneal injection of C. albicans were re-stimulated with PMA/Ionomycin for 4 h. (D) Graph displays percentage of IFN-γ-producing cells. **p<0.005 (Student's t test). Each symbol represents an individual mouse. Graph is the cumulative result of 3 independent experiments. (E) Graph displays the mean percentage +/− s.e.m. of IFN-γ-producing CD3+NK1.1CD4+, CD3+NK1.1CD4, CD3NK1.1+ and CD3+NK1.1+ cells that combine to form total IFN-γ-producing cells in (D).

Similar articles

Cited by

References

    1. Pfaller MA, Diekema DJ (2010) Epidemiology of invasive mycoses in North America. Crit Rev Microbiol 36: 1–53. - PubMed
    1. Hamad M (2008) Antifungal immunotherapy and immunomodulation: a double-hitter approach to deal with invasive fungal infections. Scandinavian journal of immunology 67: 533–543. - PubMed
    1. Lehrnbecher T, Tramsen L, Koehl U, Schmidt S, Bochennek K, et al. (2011) Immunotherapy against invasive fungal diseases in stem cell transplant recipients. Immunological investigations 40: 839–852. - PubMed
    1. Drummond RA, Saijo S, Iwakura Y, Brown GD (2011) The role of Syk/CARD9 coupled C-type lectins in antifungal immunity. Eur J Immunol 41: 276–281. - PMC - PubMed
    1. Robinson MJ, Osorio F, Rosas M, Freitas RP, Schweighoffer E, et al. (2009) Dectin-2 is a Syk-coupled pattern recognition receptor crucial for Th17 responses to fungal infection. J Exp Med 206: 2037–2051. - PMC - PubMed

Publication types

MeSH terms