. 2013 May;9(5):e1003376.
doi: 10.1371/journal.ppat.1003376. Epub 2013 May 9.

A unique spumavirus Gag N-terminal domain with functional properties of orthoretroviral matrix and capsid

Affiliations

A unique spumavirus Gag N-terminal domain with functional properties of orthoretroviral matrix and capsid

David C Goldstone et al. PLoS Pathog. 2013 May.

Abstract

The Spumaretrovirinae, or foamyviruses (FVs) are complex retroviruses that infect many species of monkey and ape. Although FV infection is apparently benign, trans-species zoonosis is commonplace and has resulted in the isolation of the Prototypic Foamy Virus (PFV) from human sources and the potential for germ-line transmission. Despite little sequence homology, FV and orthoretroviral Gag proteins perform equivalent functions, including genome packaging, virion assembly, trafficking and membrane targeting. In addition, PFV Gag interacts with the FV Envelope (Env) protein to facilitate budding of infectious particles. Presently, there is a paucity of structural information with regards FVs and it is unclear how disparate FV and orthoretroviral Gag molecules share the same function. Therefore, in order to probe the functional overlap of FV and orthoretroviral Gag and learn more about FV egress and replication we have undertaken a structural, biophysical and virological study of PFV-Gag. We present the crystal structure of a dimeric amino terminal domain from PFV, Gag-NtD, both free and in complex with the leader peptide of PFV Env. The structure comprises a head domain together with a coiled coil that forms the dimer interface and despite the shared function it is entirely unrelated to either the capsid or matrix of Gag from other retroviruses. Furthermore, we present structural, biochemical and virological data that reveal the molecular details of the essential Gag-Env interaction and in addition we also examine the specificity of Trim5α restriction of PFV. These data provide the first information with regards to FV structural proteins and suggest a model for convergent evolution of gag genes where structurally unrelated molecules have become functionally equivalent.


Conflict of interest statement

The authors have declared that no competing interests exist.

Figures
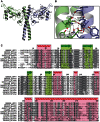
Figure 1
Figure 1. The crystal structure of the amino-terminal domain of PFV Gag.
(A) Cartoon representation of the PFV Gag-NtD homodimer, Monomer-A is shown in pale blue and Monomer-B in green. The secondary structure elements are numbered sequentially from the amino-terminus on Monomer-A. (B) Details of the Gag-NtD dimer interface located at the centre of the coiled-coil region and boxed in A. Residues that contribute to the intermolecular hydrogen-bonding network are labelled and shown in stick representation. Those with asterisks are from Monomer-A. Intermolecular hydrogen bonding interactions are shown as dashed lines. (C) Sequence alignment of foamyvirus Gag-NtDs from apes, old and new world monkeys, numbering corresponds to the PFV sequence. The position of secondary structure elements in PFV is indicated above the sequence, red coil for helices and green arrows for strands. Regions with greatest sequence homology are highlighted with grey boxes. Residues that are conserved in all sequences are also coloured white. Sequences are annotated with the database accession number and species are abbreviated as follows cpz, Chimpanzee; ogu, Orangutan; mac, Macaque; gor, Gorilla; agm, African green monkey; spm, Spider monkey; sqm, Squirrel monkey; mar, marmoset.
Figure 2
Figure 2. Conformation and solution oligomeric state of FV-Gag-NtDs.
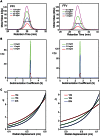
(A) SEC-MALLS analysis of PFV-Gag-NtD recorded at 2.5 mgml−1 (red), 5.0 mgml−1 (blue), 7.5 mgml−1 (green) and 10.0 mgml−1 (pink) (left panel) and FFV Gag NtD at 1.5 mgml−1 (red) 3.0 mgml−1 (blue), 6.0 mgml−1 (green) and 12.5 mgml−1 (pink) (Right panel). Differential refractive index (dRI) is plotted against retention time and the molar mass distributions, determined throughout the elution of each peak, plotted as points. (B) C(S) distributions derived from sedimentation velocity data recorded from PFV-Gag-NtD at 0.5 mgml−1 (red), 1.0 mgml−1 (blue) and 2.0 mgml−1 (green) (left panel) and FFV-Gag-NtD at 0.6 mgml−1 (red), 2.0 mgml−1 (blue) and 2.5 mgml−1 (green) (right panel). (C) Multi-speed sedimentation equilibrium profiles determined from interference data collected on PFV-Gag-NtD at 67 µM (left panel) and FFV-Gag-NtD at 50 µM (right panel). Data was recorded at the three speeds indicated. The solid lines represent the best fit to the data using a single species model.
Figure 3
Figure 3. Analysis of PFV Gag-Env interactions.
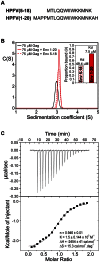
(A) Peptide sequences from the PFV Env leader used in binding experiments. (B) Sedimentation coefficient distribution functions, C(S) that best fit sedimentation velocity profiles from PFV-Gag-NtD (black) and from 75 µM equimolar mixtures of PFV-Gag-NtD with Env1–20 (solid red) and Env5–18 (dashed red). Inset, proportion bound quantified as described in methods and equilibrium dissociation constants derived from these data. (C) Interaction of PFV-Gag-NtD with Env1–20 quantified by ITC. The top panel shows the raw thermogram and the bottom panel shows the titration data along with best line of best fit and the fitted parameters (inset).
Figure 4
Figure 4. Structure of the PFV Gag-Env complex.
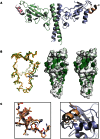
(A) Cartoon representation of the Gag-Env complex. The Gag-NtD homodimer is shown in the same orientation and colour scheme as in Figure 1 . The helical Env peptides bound at the periphery of each head domain are coloured magenta and gold with N- and C-termini indicated. (B) A structural alignment shown in stick representation of free (orange) and bound (green) Gag-NtD is shown in the left-hand panel. The view is looking into the Env binding site at 90-degree rotation from that in A. Residue P30 is highlighted to show the backbone movement that occurs in the α1-β1 loop upon Env binding. The central and right-hand panels show the distribution of surface hydrophobicity on the Gag-NtD in the free and bound structures respectively. Hydrophobicity is represented by green shading with darker regions representing the most hydrophobic areas. The backbone movement of the α1-β1 loop in the bound structure (right panel) opens up a hydrophobic pocket in order to accommodate the Env peptide. (C) A cartoon representation of the bound PFV Env1–20 peptide is shown in the left hand panel. Intramolecular hydrogen bonding between residues in the N-terminal extended region and those in the helical section are displayed as dashed lines. Residues with apolar and aromatic side chains that line one face of the helix are also labelled. Details of the Gag-Env interface are shown in the right hand panel. Gag and Env molecules are coloured as in A. Residues with apolar side chains that contribute to the hydrophobic interface are shown in stick representation.
Figure 5
Figure 5. Sedimentation velocity analysis of Gag-Env interface mutants.
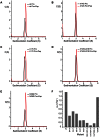
C(S) functions that best fit sedimentation velocity profiles from (A) wt PFV-Gag-NtD, (B) V14S, (C) L17S, (D) V14S/L21S and (E) N29Q mutants. The C(S) function from 75 µM Gag-NtD (black) and from 75 µM equimolar mixtures of Gag-NtDs with Env(1–20) (red) are shown in each panel. (F) Histogram of equilibrium association constants derived from the sedimentation data as described in methods.
Figure 6
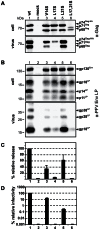
Figure 6. Infectivity and particle budding of Gag mutants.
293T cells were co-transfected with equal amounts of PFV transfer vector puc2MD9, Env packaging construct pcoPE, Pol packaging construct pcoPP and various Gag packaging constructs (wt: pcziPG CLHH; V14S: pcziPG CLHH V14S; L17S: pcziPG CLHH L17S; L21S: pcziPG CLHH L21S; L17, 21S: pcziGag4 L17, 21S) or only with pUC19 (mock) as indicated. Western blot analysis of cell lysates (cell) and pelleted viral supernatants (virus) using (A) polyclonal antibodies specific for PFV-Gag (α-Gag) or (B) rabbit polyclonal antibodies specific for PFV Env-LP (α-LP). The identity of the individual proteins is indicated on the right. (C) Relative amounts of released Gag and RT quantified from Western blots from two independent experiments (n = 2–4). (D) Relative infectivity of extracellular 293T cell culture supernatants using an eGFP marker gene transfer assay were determined 3 days post infection. The values obtained using the wild type Gag packaging vector were arbitrarily set to 100%. Absolute titres of these plain supernatants were 8.7±3.3×10⁶ EGFP ffu/ml. Means and standard deviations of three independent experiments (n = 3–6) are shown.
Figure 7
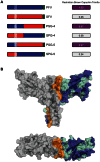
Figure 7. Restriction of foamy viruses.
(A) Schematic bar representations of Gag from PFV (blue) and SFVmac (red) along with chimeric PSG-4 (amino acids 1–311 PFV + 302–647 SFV), SPG-4 (amino acids 1–301 SFV + 312–648 PFV), PSG-5 (amino acids 1–195 PFV + 187–647 SFV) and SPG-5 (amino acids 1–186 SFV + 196–648 PFV) are shown on the left with C-terminal Gag P3 peptide coloured green and coiled coil regions hatched. Restriction of each virus by Brown Capuchin Trim5α is shown on the right. The values are the average from three independent experiments detailed in full in Supplementary Figure S3. (B) Mapping of the interfacial, conserved and non-conserved residues onto the PFV structure. The structure of PFV -Gag-Ntd is shown as a semi transparent surface surrounding a cartoon ribbon representation of the protein backbone. Residues that contribute to the dimer interface are shown in orange. Residues that are sequence conserved in SFVmac and PFV are displayed in cyan and residues that are surface-exposed and non-conserved are displayed in blue.
Figure 8
Figure 8. Location of CTRSs in PFV-Gag-Ntd and MPMV MA.
(A) PFV-Gag-NtD and (B) MPMV MA are shown in cartoon representation. Residues that make up the proposed CTRS are shown in stick representation. The conserved di-aromatic motifs are highlighted in dark blue and shown in close up, in the right-hand panels.

Similar articles

Cited by

References

    1. Lecellier CH, Saib A (2000) Foamy viruses: between retroviruses and pararetroviruses. Virology 271: 1–8. - PubMed
    1. Herchenroder O, Renne R, Loncar D, Cobb EK, Murthy KK, et al. (1994) Isolation, cloning, and sequencing of simian foamy viruses from chimpanzees (SFVcpz): high homology to human foamy virus (HFV). Virology 201: 187–199. - PubMed
    1. Bieniasz PD, Rethwilm A, Pitman R, Daniel MD, Chrystie I, et al. (1995) A comparative study of higher primate foamy viruses, including a new virus from a gorilla. Virology 207: 217–228. - PubMed
    1. Broussard SR, Comuzzie AG, Leighton KL, Leland MM, Whitehead EM, et al. (1997) Characterization of new simian foamy viruses from African nonhuman primates. Virology 237: 349–359. - PubMed
    1. Saib A (2003) Non-primate foamy viruses. Curr Top Microbiol Immunol 277: 197–211. - PubMed

Publication types

Substances