. 2013 May 9:7:52.
doi: 10.3389/fncom.2013.00052. eCollection 2013.

Distinguishing synchronous and time-varying synergies using point process interval statistics: motor primitives in frog and rat

Affiliations

Distinguishing synchronous and time-varying synergies using point process interval statistics: motor primitives in frog and rat

Corey B Hart et al. Front Comput Neurosci. .

Abstract

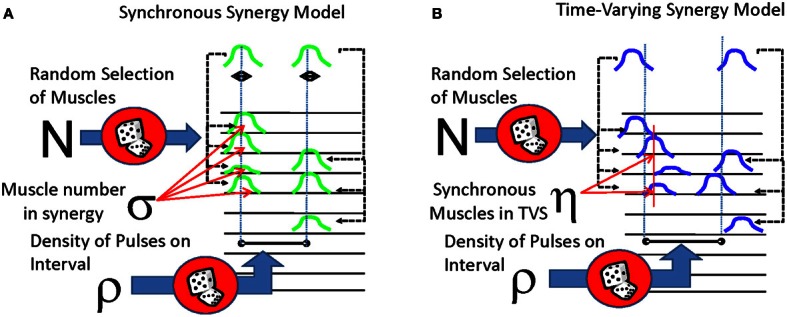
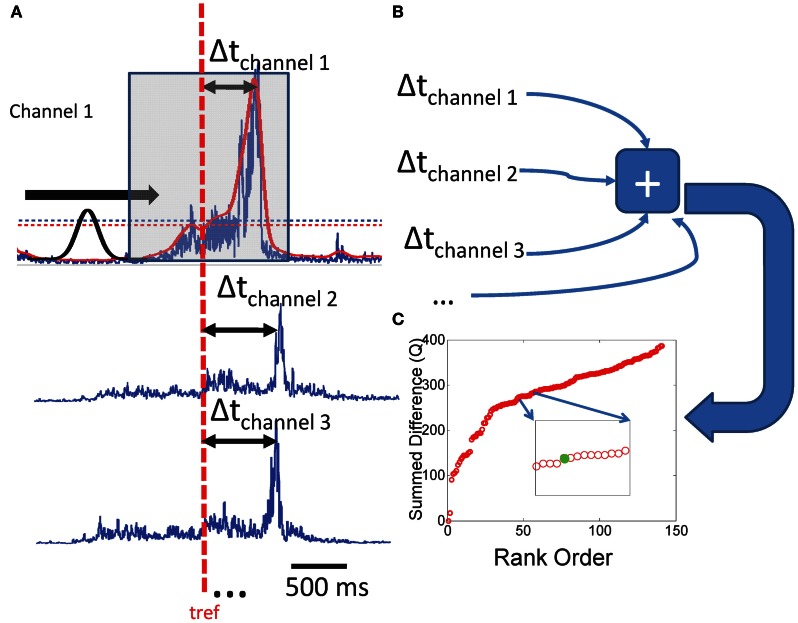
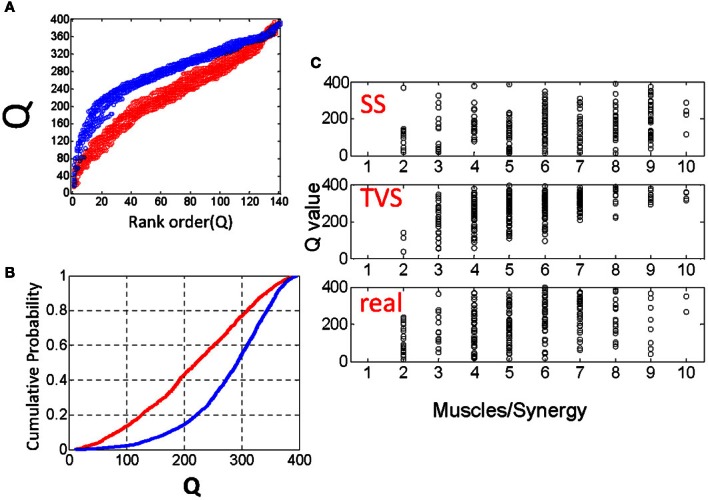
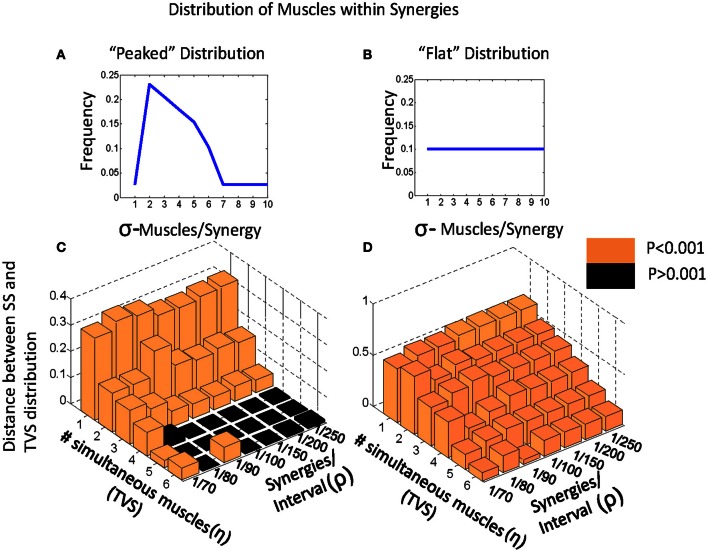
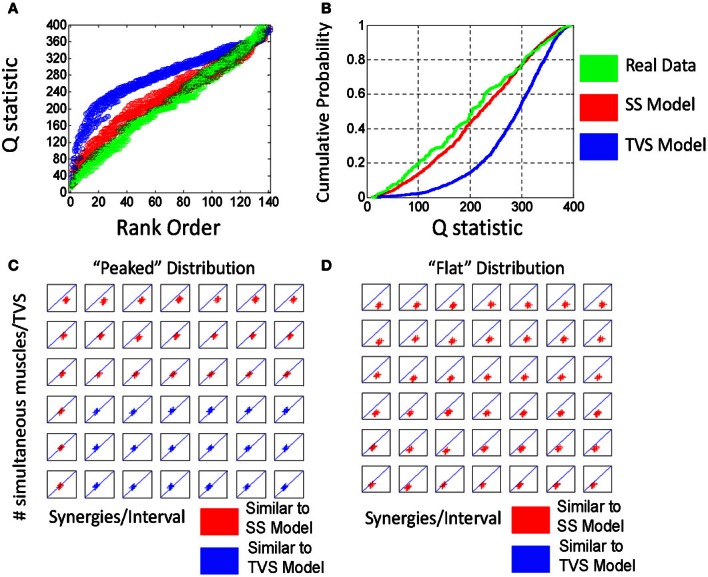
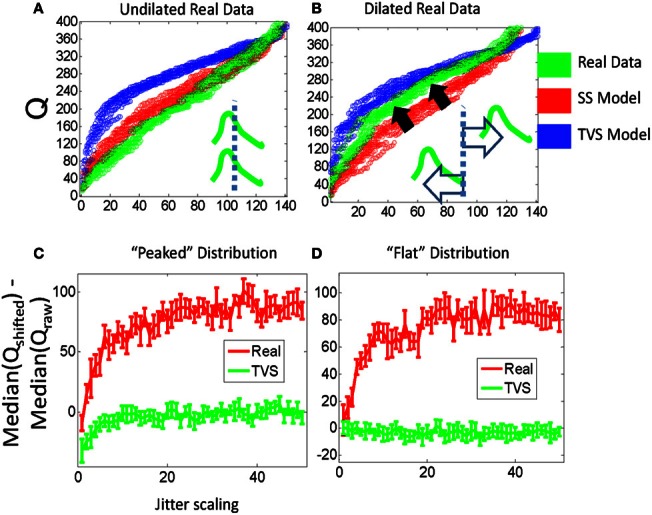
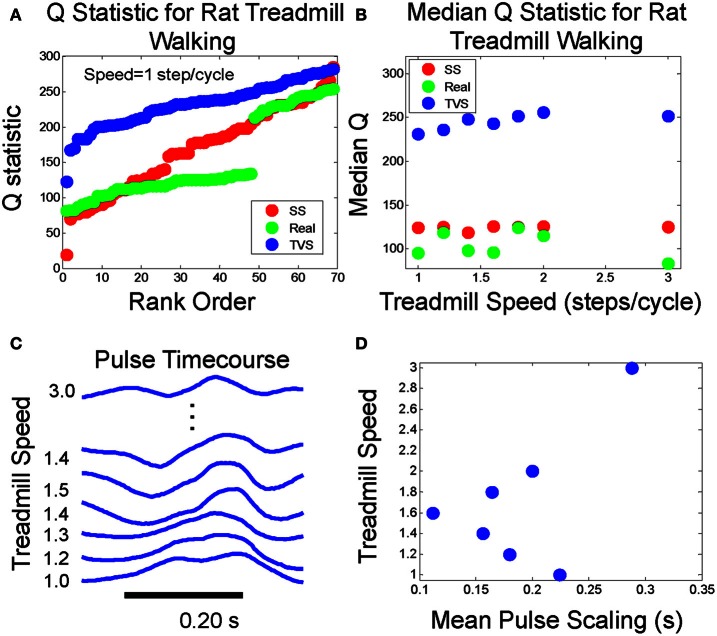
We present and apply a method that uses point process statistics to discriminate the forms of synergies in motor pattern data, prior to explicit synergy extraction. The method uses electromyogram (EMG) pulse peak timing or onset timing. Peak timing is preferable in complex patterns where pulse onsets may be overlapping. An interval statistic derived from the point processes of EMG peak timings distinguishes time-varying synergies from synchronous synergies (SS). Model data shows that the statistic is robust for most conditions. Its application to both frog hindlimb EMG and rat locomotion hindlimb EMG show data from these preparations is clearly most consistent with synchronous synergy models (p < 0.001). Additional direct tests of pulse and interval relations in frog data further bolster the support for synchronous synergy mechanisms in these data. Our method and analyses support separated control of rhythm and pattern of motor primitives, with the low level execution primitives comprising pulsed SS in both frog and rat, and both episodic and rhythmic behaviors.

Keywords: point process; primitives; synchronous synergy; synergy; time-varying synergy.


Figures

Figure 1
Figure 1
Two forms of synergistic muscle activity compared in this analysis. (A) Synchronous synergy model. Pulses are multiplexed to several muscles to several muscles, with tight coordination of temporal activity of each pulse. (B) Time-varying synergy model. Pulses are sent to several muscles with some time delay between them, and the entire set of pulses and delays may be dilated or contracted as necessary. In both models, the delay between different synergys is drawn from an exponential distribution (or in a few cases, from a uniform distribution).
Figure 2
Figure 2
Calculation of the Q statistic. (A) On an interval ranging from −250 to 250 ms, we identify peaks in a rectified and smoothed set of EMG waveforms by sliding a gaussian waveform along the intervals and identifying points of maximum correlation with amplitudes larger than a rejection amplitude (more than 2 sds the mean EMG activity). Peak times are subtracted from a randomly drawn reference time from each interval, and the (B) absolute differences are summed over that interval. (C) The same procedure is performed for all such non-overlapping intervals on the data set. The resultant Q values are rank ordered for the purpose of comparing distributions from different sets of data.
Figure 3
Figure 3
(A) Comparison of rank ordered Q statistics from five runs of the basic TVS model (blue) (ρ = peaked distribution, σ = 3, η = 1) and five runs of the basic SS model. (B) cumulative probability of the same Q distributions. (C) Comparison of the effect of ρ on local Q statistics for SS models, TVS models, and real data. Note that as ρ increases, Q statistics tend toward higher for TVS models than for real or SS constructed model data.
Figure 4
Figure 4
Varying model parameters alters discriminability of models. (A) A sharply peaked distribution. (B) A flat synergy distribution. (C) The peaked distribution resulted in easy discrimination of TVS models from SS models at an alpha level of 0.001 for up to three simultaneous synergies in TVS models. (D) The flat synergy distribution results in discrimination of TVS models from SS models for all values of ρ (density of synergies on an interval) and all η (the number of simultaneous muscles in a TVS).
Figure 5
Figure 5
Q statistically classifies real from EMG data as a synchronous synergy strategy for range of discriminability of the statistic. Linear discriminant separates Qss-Qreal (y axis) and Qtvs-Qreal (x axis). (A) In data drawn from the peaked distribution. (B) Cumulative probability shows TVS/SS distinction. (C) For peaked distribution (see Figure 4A) we find that for a range of discriminable parameters (see Figure 4A) plotted points are less than unity, indicating Qss-Qreal < Qtvs-Qreal. All parameter pairs ρ and η show Qss-Qreal < Qtvs-Qreal. (D) For flat distribution (see Figure 4B) all parameter pairs ρ and η Qss-Qreal < Qtvs-Qreal. In both cases, this is consistent with a model where EMG activity is generated via an SS-type strategy.
Figure 6
Figure 6
Stretching the interval between jittered pulses causes real data that resembles SS model data to begin to resemble data generated by a TVS strategy, for a fixed analysis window. (A) The Q statistic distribution of real data (green, left) which is clearly SS in form, is moved toward the Q statistic distribution of the TVS model data when intervals between real data are scaled linearly with an unscaled analysis window (B). (C) Peaked σ-distribution: comparing the difference between scaled Q stats of real data and their unscaled values with scaled TVS Q values and the unscaled Q values implies real data is clustered more tightly around particular time scales (i.e., there is more room to scale intervals within the window before a timestamp is forced into the next counting interval and drops from the statistic) compared to TVS generated data. (D) Flat σ-distribution: note the nearly identical performance to that in (C).
Figure 7
Figure 7
Direct tests of whether pulse durations and pulse intervals are independent. PCA on regressions between inter pulse delays and pulse duration time scales and ICA of delays and timescales together do not support a time-varying synergy model for real frog data. (A) Regression coefficient between pulse widths (D) and those between pulse time delays (S12, S31, and S23) in triplets of active motor primitives are large relative to cross terms. Additionally, these large terms align with axes defined by two largest principal components. (B) Mixing matrix coefficients from an independent component analysis on time series defined by each peak time difference from first element in each triplet concatenated to the scale of the pulses during counting interval demonstrate a strong segregation of time-scale related information and peak time related information. Taken together, these results indicate that the duration of pulses in the EMG do not scale linearly with the variations in the interval to their time of occurrence, which is a prediction of a TVS model.
Figure 8
Figure 8
(A) Temperature plot of pulse amplitudes during treadmill walking in one animal. Overlay: average pulse waveform over all steps. (B) Step cycle duration variability does not appear to induce any systematic variability in EMG pulse full width at half max, as a TVS model predicts.
Figure 9
Figure 9
(A) Q statistic computed on rat walking on treadmill at 1 step/cycle compared to Q statistics for cyclic runs of SS and TVS model. (B) Median Q statistics for real, SS, and TVS models as a function of treadmill speed. (C) Example pulse waveforms at each treadmill speed. (D) Mean pulse duration scaling relationship with increasing treadmill speed is non-monotonic.

Similar articles

Cited by

References

    1. Adams L., Datta A. K., Guz A. (1989). Synchronization of motor unit firing during different respiratory and postural tasks in human sternocleidomastoid muscle. J. Physiol. 413, 213–231 - PMC - PubMed
    1. Bizzi E., Cheung V. C., d'Avella A., Saltiel P., Tresch M. (2008). Combining modules for movement. Brain Res. Rev. 57, 125–133 10.1016/j.brainresrev.2007.08.004 - DOI - PMC - PubMed
    1. Bizzi E., Hogan N., Mussa-Ivaldi F. A., Giszter S. (1992). Does the nervous system use equilibrium point control to guide single and multiple joint movements? Behav. Brain Sci. 15, 603–613 10.1017/S0140525X00072538 - DOI - PubMed
    1. Bizzi E., Mussa-Ivaldi F., Giszter S. (1991). Computations underlying the execution of movement: a biological perspective. Science 253, 287–291 10.1126/science.1857964 - DOI - PubMed
    1. Bremner F. D., Baker J. R., Stephens J. A. (1991a). Correlation between the discharges of motor units recorded from the same and from different finger muscles in man. J. Physiol. 432, 355–380 - PMC - PubMed

LinkOut - more resources