

Population trends and variation in body mass index from 1971 to 2008 in the Framingham Heart Study Offspring Cohort
- PMID: 23675464
- PMCID: PMC3651246
- DOI: 10.1371/journal.pone.0063217
Population trends and variation in body mass index from 1971 to 2008 in the Framingham Heart Study Offspring Cohort
Abstract
Objective: We examined body mass index (BMI) across place and time to determine the pattern of BMI mean and standard deviation trajectories.
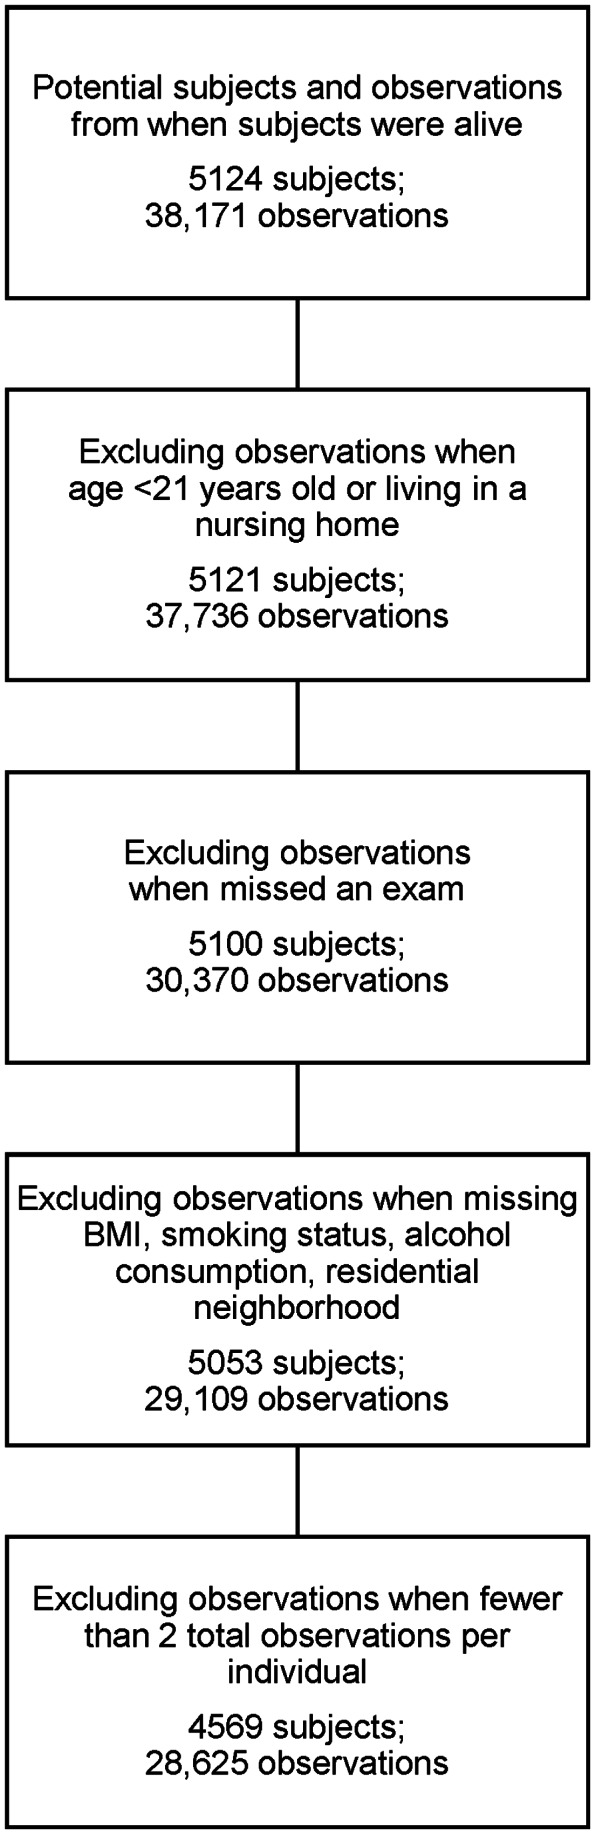
Methods: We included participants in the Framingham Heart Study (FHS) Offspring Cohort over eight waves of follow-up, from 1971 to 2008. After exclusions, the final sample size was 4569 subjects with 28,625 observations. We used multi-level models to examine population means and variation at the individual and neighborhood (census tracts) levels across time with measured BMI as the outcome, controlling for individual demographics and behaviors and neighborhood poverty. Because neighborhoods accounted for limited BMI variance, we removed this level as a source of variation in final models. We examined sex-stratified models with all subjects and models stratified by sex and baseline weight classification.
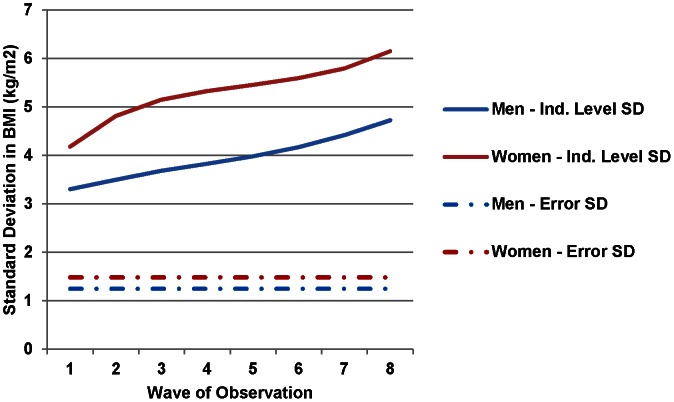
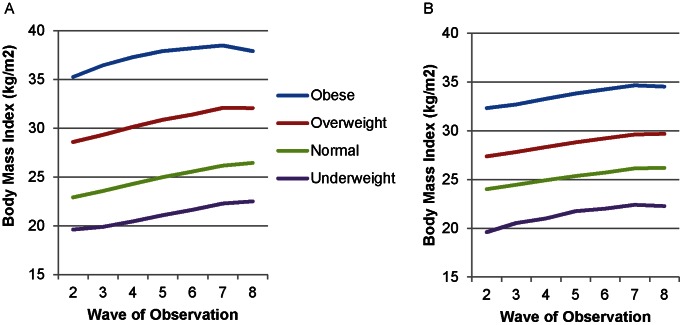
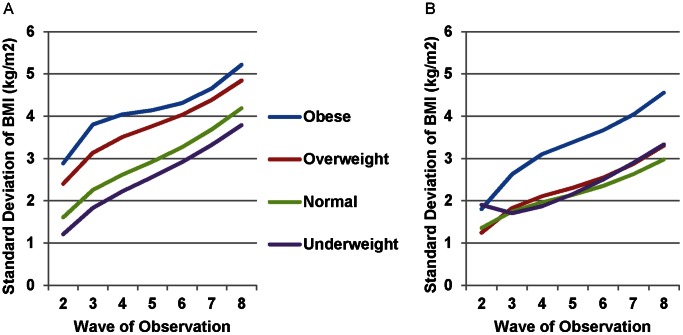
Results: Mean BMI increased from 24.0 kg/m(2) at Wave 1 to 27.7 at Wave 8 for women and from 26.6 kg/m(2) to 29.0 for men. In final models, BMI variation also increased from Waves 1 to 8, with the standard deviation increasing from 4.18 kg/m(2) to 6.15 for women and 3.31 kg/m(2) to 4.73 for men. BMI means increased in parallel across most baseline BMI weight classifications, except for more rapid increases through middle-age for obese women followed by declines in the last wave. BMI standard deviations also increased in parallel across baseline BMI classifications for women, with greater divergence of BMI variance for obese men compared to other weight classifications.
Conclusion: Over nearly 40 years, BMI mean and variation increased in parallel across most baseline weight classifications in our sample. Individual-level characteristics, especially baseline BMI, were the primary factors in rising BMI. These findings have important implications not only for understanding the sources of the obesity epidemic in the United States but also for the targeting of interventions to address the epidemic.
Conflict of interest statement
Figures
References
-
- Ogden C, Fryar C, Carroll M, Flegal K (2004) Mean body weight, height, and body mass index, United States, 1960–2002. Advance Data From Vital and Health Statistics; no. 347. Hyattsville, MD: National Center for Health Statistics. - PubMed
-
- Flegal KM, Carroll MD, Kit BK, Ogden CL (2012) Prevalence of obesity and trends in the distribution of body mass index among US adults, 1999–2010. JAMA 307: 491–497. - PubMed
-
- Malhotra R, Trulsostbye, Riley CM, Finkelstein E (2013) Young adult weight trajectories through midlife by body mass category. Obesity (Silver Spring) Epub ahead of print. - PubMed
-
- Ogden CL, Carroll MD (2010) Health E-stats: Prevalence of overweight, obesity and extreme obesity among adults: United States, trends 1960–1962 through 2007–2008. Hyattsville, MD: National Center for Health Statistics.
-
- Flegal KM, Carroll MD, Ogden CL, Curtin LR (2010) Prevalence and trends in obesity among US adults, 1999–2008. JAMA 303: 235–241. - PubMed
Publication types
MeSH terms
Grants and funding
LinkOut - more resources
Full Text Sources
Other Literature Sources
Medical
