

Impact of genotype 1 and 2 of porcine reproductive and respiratory syndrome viruses on interferon-α responses by plasmacytoid dendritic cells
- PMID: 23675981
- PMCID: PMC3672080
- DOI: 10.1186/1297-9716-44-33
Impact of genotype 1 and 2 of porcine reproductive and respiratory syndrome viruses on interferon-α responses by plasmacytoid dendritic cells
Erratum in
- Vet Res. 2013;44:74
Abstract
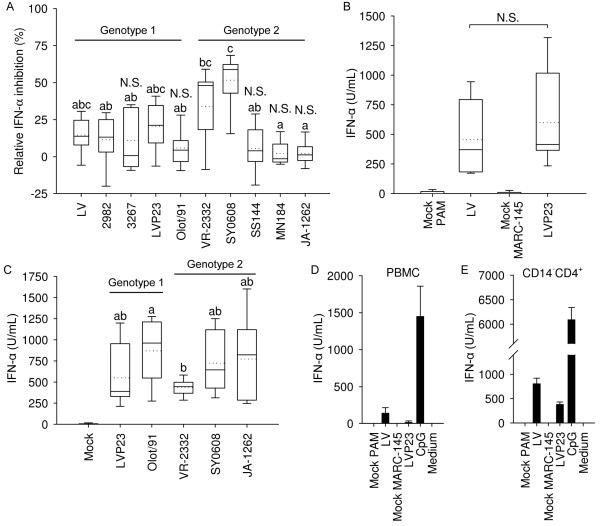
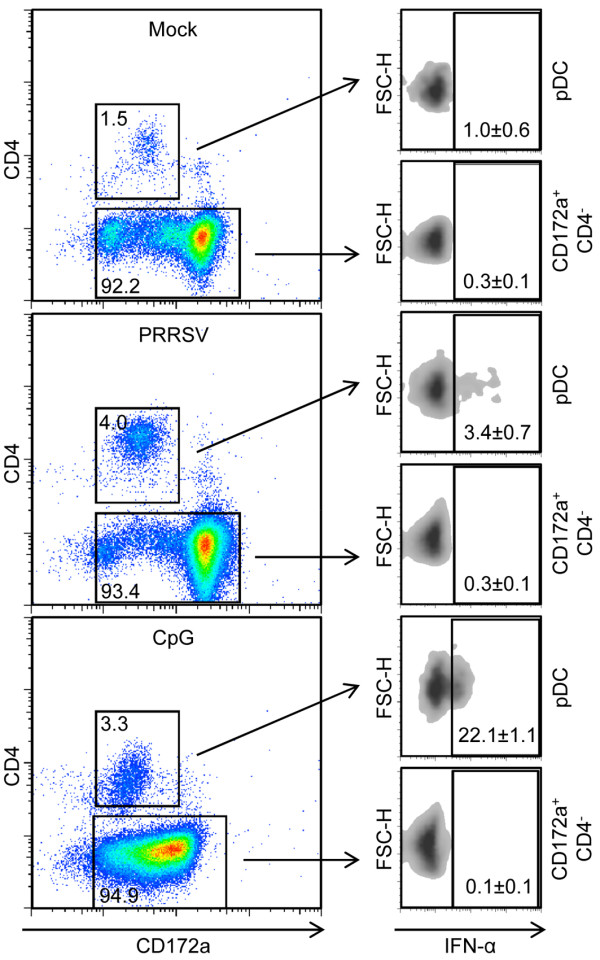
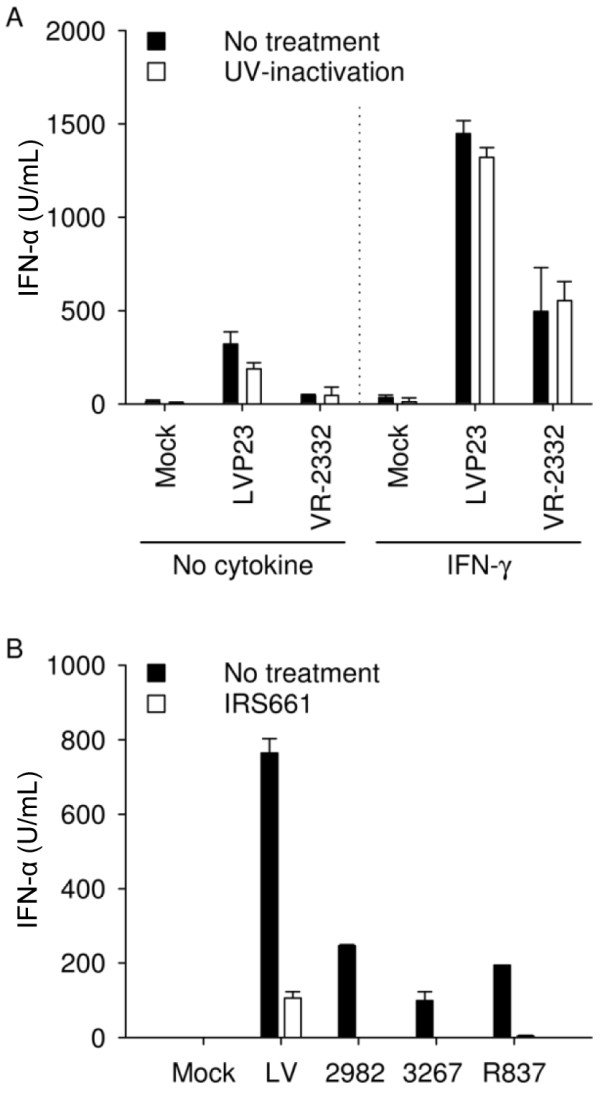
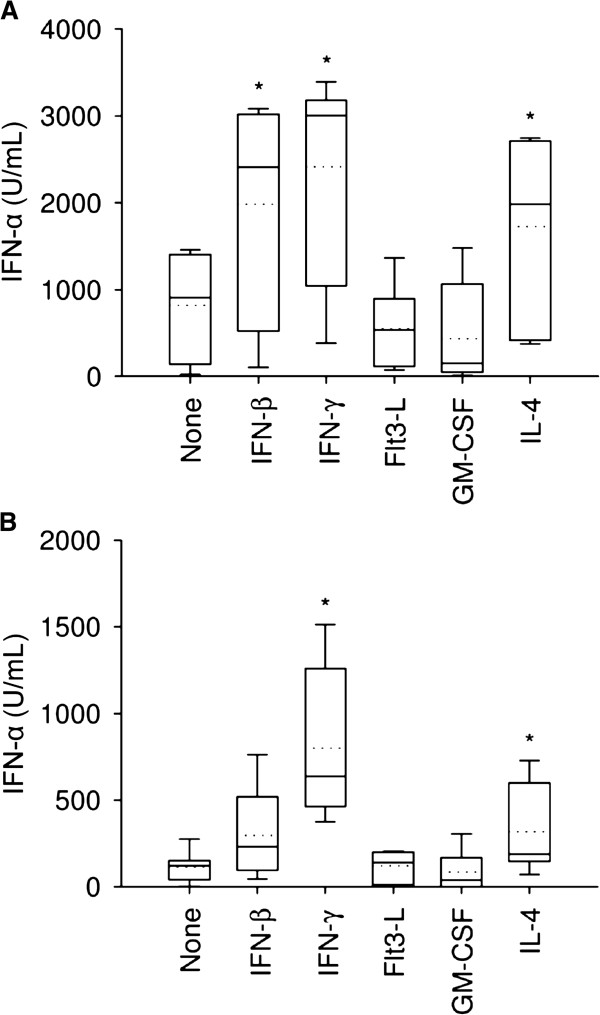
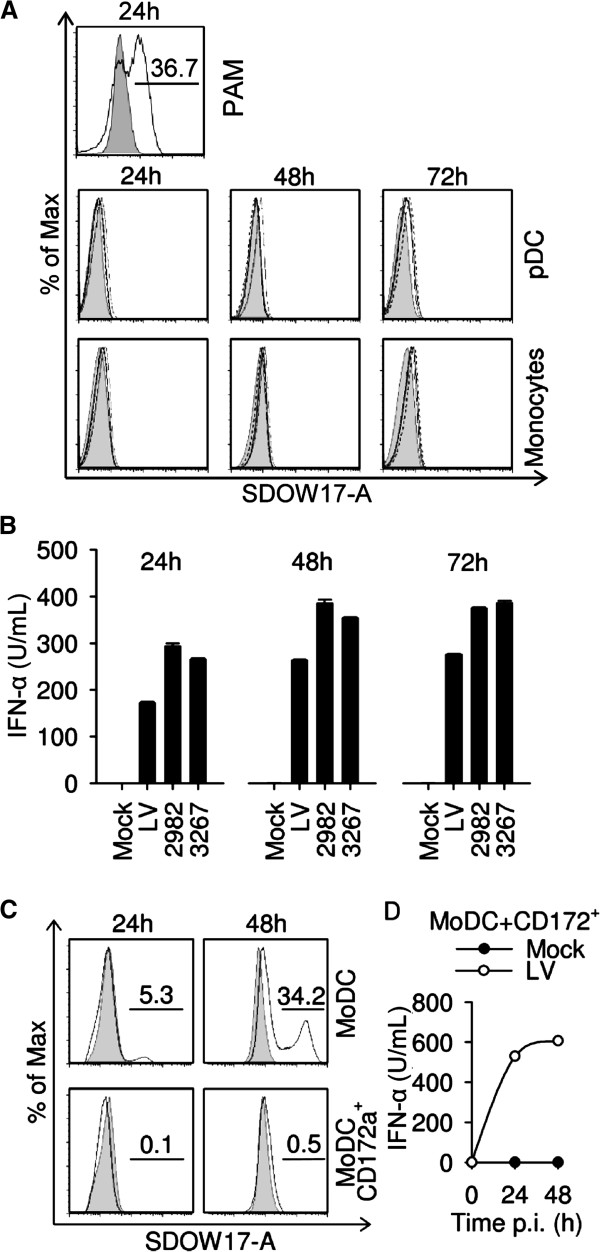
Porcine reproductive and respiratory syndrome (PRRS) virus (PRRSV) infections are characterized by prolonged viremia and viral shedding consistent with incomplete immunity. Type I interferons (IFN) are essential for mounting efficient antiviral innate and adaptive immune responses, but in a recent study, North American PRRSV genotype 2 isolates did not induce, or even strongly inhibited, IFN-α in plasmacytoid dendritic cells (pDC), representing "professional IFN-α-producing cells". Since inhibition of IFN-α expression might initiate PRRSV pathogenesis, we further characterized PRRSV effects and host modifying factors on IFN-α responses of pDC. Surprisingly, a variety of type 1 and type 2 PRRSV directly stimulated IFN-α secretion by pDC. The effect did not require live virus and was mediated through the TLR7 pathway. Furthermore, both IFN-γ and IL-4 significantly enhanced the pDC production of IFN-α in response to PRRSV exposure. PRRSV inhibition of IFN-α responses from enriched pDC stimulated by CpG oligodeoxynucleotides was weak or absent. VR-2332, the prototype genotype 2 PRRSV, only suppressed the responses by 34%, and the highest level of suppression (51%) was induced by a Chinese highly pathogenic PRRSV isolate. Taken together, these findings demonstrate that pDC respond to PRRSV and suggest that suppressive activities on pDC, if any, are moderate and strain-dependent. Thus, pDC may be a source of systemic IFN-α responses reported in PRRSV-infected animals, further contributing to the puzzling immunopathogenesis of PRRS.
Figures
Similar articles
-
Virulence and genotype-associated infectivity of interferon-treated macrophages by porcine reproductive and respiratory syndrome viruses.Virus Res. 2014 Jan 22;179:204-11. doi: 10.1016/j.virusres.2013.08.009. Epub 2013 Nov 9. Virus Res. 2014. PMID: 24220223
-
Regulation of toll-like receptors 3, 7 and 9 in porcine alveolar macrophages by different genotype 1 strains of porcine reproductive and respiratory syndrome virus.Vet Immunol Immunopathol. 2014 Apr 15;158(3-4):189-98. doi: 10.1016/j.vetimm.2014.01.009. Epub 2014 Jan 25. Vet Immunol Immunopathol. 2014. PMID: 24534144
-
North American porcine reproductive and respiratory syndrome viruses inhibit type I interferon production by plasmacytoid dendritic cells.J Virol. 2011 Mar;85(6):2703-13. doi: 10.1128/JVI.01616-10. Epub 2010 Dec 29. J Virol. 2011. PMID: 21191013 Free PMC article.
-
Antagonizing interferon-mediated immune response by porcine reproductive and respiratory syndrome virus.Biomed Res Int. 2014;2014:315470. doi: 10.1155/2014/315470. Epub 2014 Jul 3. Biomed Res Int. 2014. PMID: 25101271 Free PMC article. Review.
-
Innate and adaptive immunity against Porcine Reproductive and Respiratory Syndrome Virus.Vet Immunol Immunopathol. 2015 Sep 15;167(1-2):1-14. doi: 10.1016/j.vetimm.2015.07.003. Epub 2015 Jul 17. Vet Immunol Immunopathol. 2015. PMID: 26209116 Free PMC article. Review.
Cited by
-
Genome-wide analysis of the transcriptional response to porcine reproductive and respiratory syndrome virus infection at the maternal/fetal interface and in the fetus.BMC Genomics. 2016 May 20;17:383. doi: 10.1186/s12864-016-2720-4. BMC Genomics. 2016. PMID: 27207143 Free PMC article.
-
Porcine reproductive and respiratory syndrome virus suppresses post-transcriptionally the protein expression of IFN-β by upregulating cellular microRNAs in porcine alveolar macrophages in vitro.Exp Ther Med. 2018 Jan;15(1):115-126. doi: 10.3892/etm.2017.5397. Epub 2017 Oct 30. Exp Ther Med. 2018. PMID: 29387185 Free PMC article.
-
Immune Control of PRRS: Lessons to be Learned and Possible Ways Forward.Front Vet Sci. 2014 Oct 14;1:2. doi: 10.3389/fvets.2014.00002. eCollection 2014. Front Vet Sci. 2014. PMID: 26664910 Free PMC article. Review.
-
Swine Dendritic Cell Response to Porcine Reproductive and Respiratory Syndrome Virus: An Update.Front Immunol. 2021 Jul 28;12:712109. doi: 10.3389/fimmu.2021.712109. eCollection 2021. Front Immunol. 2021. PMID: 34394113 Free PMC article. Review.
-
A Spanish Porcine Reproductive and Respiratory Syndrome Virus 1 Strain Is Highly Virulent in Pigs Under Experimental Conditions.Transbound Emerg Dis. 2025 May 23;2025:4847981. doi: 10.1155/tbed/4847981. eCollection 2025. Transbound Emerg Dis. 2025. PMID: 40453458 Free PMC article.
References
Publication types
MeSH terms
Substances
LinkOut - more resources
Full Text Sources
Other Literature Sources
