. 2013 May 15:14:331.
doi: 10.1186/1471-2164-14-331.

Differential transcript isoform usage pre- and post-zygotic genome activation in zebrafish

Affiliations

Differential transcript isoform usage pre- and post-zygotic genome activation in zebrafish

Håvard Aanes et al. BMC Genomics. .

Abstract

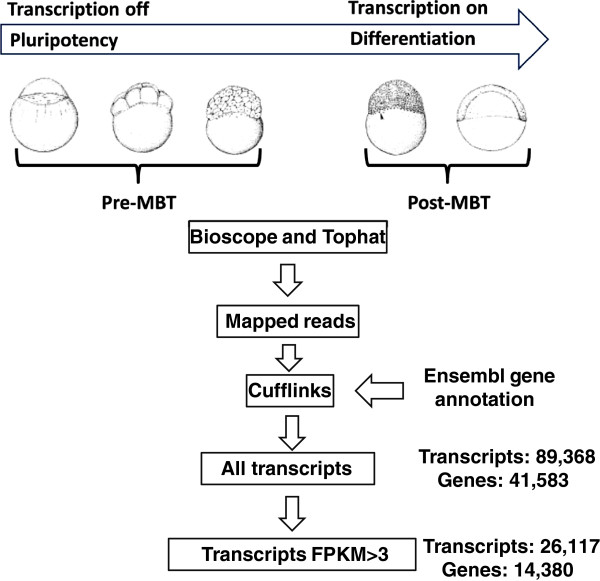
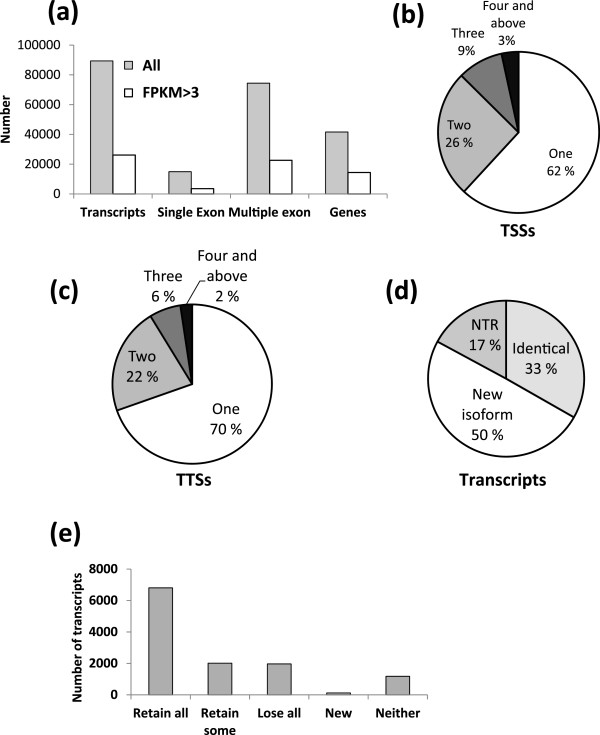
Background: Zebrafish embryos are transcriptionally silent until activation of the zygotic genome during the 10th cell cycle. Onset of transcription is followed by cellular and morphological changes involving cell speciation and gastrulation. Previous genome-wide surveys of transcriptional changes only assessed gene expression levels; however, recent studies have shown the necessity to map isoform-specific transcriptional changes. Here, we perform isoform discovery and quantification on transcriptome sequences from before and after zebrafish zygotic genome activation (ZGA).

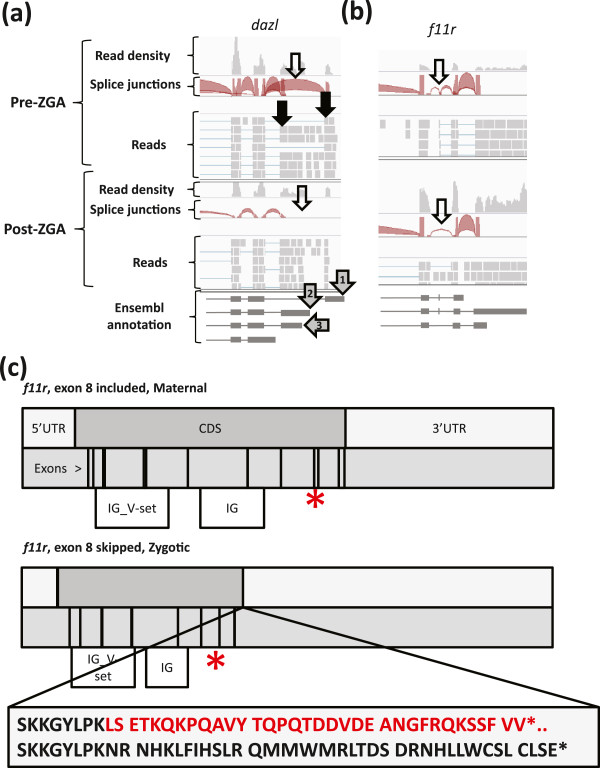
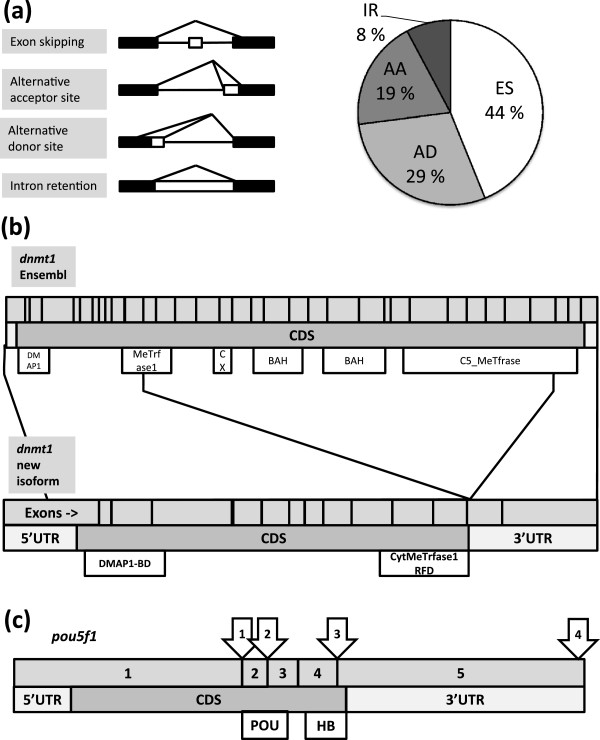
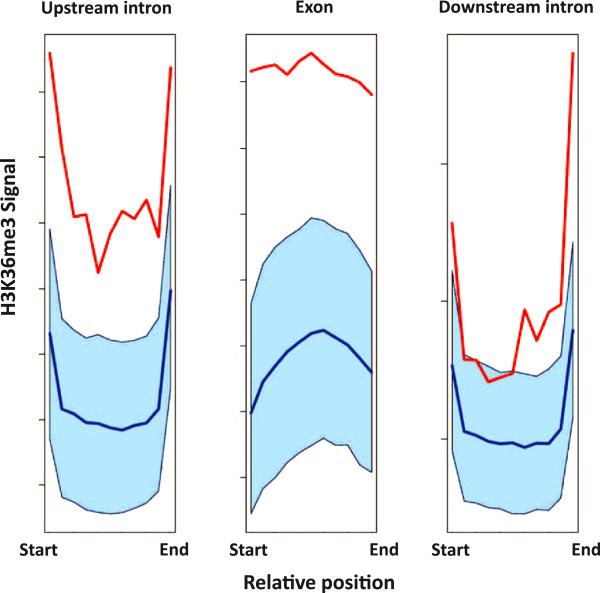
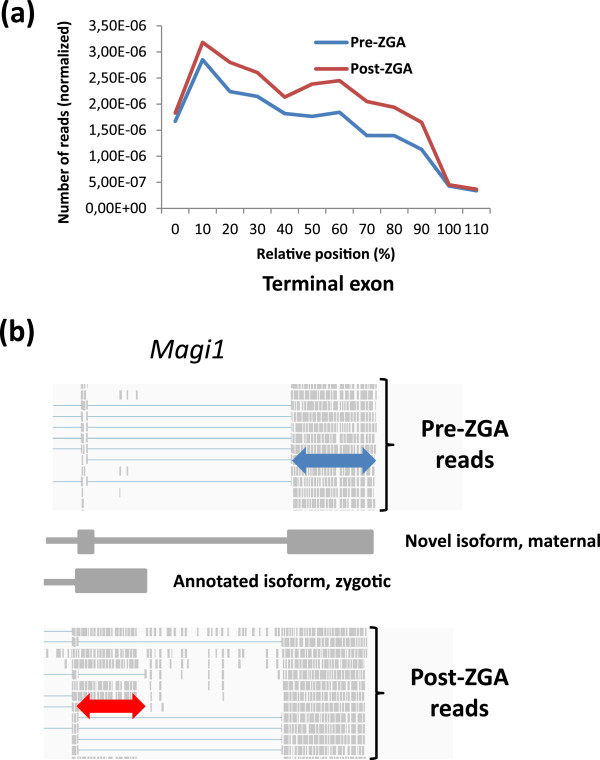
Results: We identify novel isoforms and isoform switches during ZGA for genes related to cell adhesion, pluripotency and DNA methylation. Isoform switching events include alternative splicing and changes in transcriptional start sites and in 3' untranslated regions. New isoforms are identified even for well-characterized genes such as pou5f1, sall4 and dnmt1. Genes involved in cell-cell interactions such as f11r and magi1 display isoform switches with alterations of coding sequences. We also detect over 1000 transcripts that acquire a longer 3' terminal exon when transcribed by the zygote compared to their maternal transcript counterparts. ChIP-sequencing data mapped onto skipped exon events reveal a correlation between histone H3K36 trimethylation peaks and skipped exons, suggesting epigenetic marks being part of alternative splicing regulation.

Conclusions: The novel isoforms and isoform switches reported here include regulators of transcriptional, cellular and morphological changes taking place around ZGA. Our data display an array of isoform-related functional changes and represent a valuable resource complementary to existing early embryo transcriptomes.


Figures

Figure 1
Figure 1
Transcript isoform analysis pipeline. Mapped reads from the egg and three pre-MBT samples (1-cell, 16-cell and 256-cell) were merged to represent the maternal transcriptome. This period is characterized by absence of transcription and pluripotent blastomeres. Two samples were merged to represent the first zygotic transcriptome, representing the embryo when cells start to differentiate and transcription has begun. The RNA-seq reads were mapped using two different aligners (Tophat and Bioscope) and Cufflinks was used to construct transcriptomes guided by Ensembl annotation. This resulted in a complete gene annotation set (‘all’) comprising both expressed and non-expressed genes and one dataset with robust >3 FPKM level of expression (FPKM > 3). Embryo illustrations are from Kimmel et al. (1995).
Figure 2
Figure 2
Characterization of the pre-ZGA and post-ZGA embryo transcriptomes. (a) Number of genes, transcripts and transcripts with one or more exons in the all and FPKM > 3 datasets. (b) Percentages of loci with 1, 2, 3 or more TSSs. (c) Percentages of loci with 1, 2, 3 or more TTSs. (d) Percentage of isoforms classified as NTR, identical (known) or new in the FPKM > 3 dataset. (e) Difference between the novel and annotated transcripts on functional domain(s) content. Most novel isoforms had retained all functional domains as compared to their closest matching annotated counterpart.
Figure 3
Figure 3
Dazl TSS switching and f11r exon skipping switch. (a) A screenshot from Integrative Genomics Viewer shows that dazl has been transcribed from at least two TSS’s in the maternal transcriptome; grey arrows 1–3 at bottom indicate Ensembl annotated TSSs. Black arrows in the upper panel indicate reads supporting promoter 1 (rightmost black arrow) and promoter 2/3 (leftmost black arrow; our data cannot distinguish between TSS 2 and 3). A white arrow in the upper panel points at a splice junction ‘bridge’ (red), symbolizing the splice junction for the most distal first exon. The thickness of splice junction symbols is correlated with the number of reads supporting the junction. Post-ZGA transcripts lack the most 5’ exon as can be observed from the absence of reads supporting the splice junction originating from this exon (white arrow, bottom panel). (b) Pre-ZGA an f11r isoform with exon 8 included is present (white arrow, top panel). Post-ZGA a different f11r isoform, this one with exon 8 lacking, has been transcribed (white arrow, bottom panel). (c) The f11r exon skipping (red asterix) leads to a frame shift resulting in a 6 nt longer ORF, including the removal of two C-terminal valine residues. Two functional domains, immunoglobulin V-set domain (PF07686) and immunoglobulin domain (PF00047) (white bars) are intact in both splice isoforms.
Figure 4
Figure 4
Alternative splicing in the early embryo. (a) The frequency of 4 different alternative splicing events: Exon skipping (ES), alternative acceptor site (AA), alternative donor site (AD) and intron retention (IR). ES is the most frequent AS event. In most ES events multiple exons are skipped. (b) Schematic representation of an annotated version (top) and a new (bottom) isoform for dnmt1. Black lines between the isoforms represent the conserved area. Functional domains (white bars) were defined by Pfam: DMAP1 binding domain (DMAP1-BD, PF06464), Cytosine specific methyltransferase replication foci domain (Cyt MeTrfase1 RFD, PF12047), CXXC zinc finger domain (“CX”: Znf CXXC, PF02008), Bromo-adjacent homology domain (BAH, PF01426), C-5 cytosine-specific DNA methylase domain (C5_ MeTfrase, PF00145). In the new isoform 19 exons are skipped, and all functional domains except a DMAP1 binding domain are lost. The novel isoform also have a longer 5’UTR relative to the annotated version. (c) Novel pou5f1 isoforms. The annotated version of pou5f1 has two Pfam domains; Homeobox domain (HB, PF00046) and POU (PF00157). We identify 3 novel alternative acceptor sites (arrows 1–3) all within the CDS of pou5f1. The first leads to a 3 nt deletion and removal of one glutamic acid, upstream of the POU; the second a 19 nt insertion causing a frame shift and a truncated Pou5f1 protein with both functional domains lost; the third event gives a 4 nt deletion which truncates the HB. We also detect a longer 3’ UTR post-ZGA (arrow 4).
Figure 5
Figure 5
Metagene projections of average H3K36me3 enrichment levels over skipped exons and surrounding introns. Metagenes based on H3K36me3 levels for upstream introns, skipped exons and downstream introns show increased H3K36me3 levels in the upstream intron and the exon, but only to minor extent in the downstream intron, as compared to background. Red line = transcripts with skipping event. Blue line = random set of introns and exons with confidence interval (light blue shaded region). The X-axis is in percentage of total length (start = 0% and end = 100%) and the Y-axis is the H3K36me3 signal normalized against input control and the total number of reads in the sample.
Figure 6
Figure 6
Extended 3’ terminal exons and alternative last exons. (a) Metagene representation of RNA-seq reads for the last exon in a set of transcripts detected with more coverage in the proximal half of the terminal exon post-ZGA (red line) as compared to pre-ZGA (blue line). X-axis is in percentage of total length and Y-axis is number of reads normalized against total number of reads in the samples. (b) The gene magi1 displays a change in the expression of its isoforms pre- and post-ZGA with an alternative 3’UTR appearing post-ZGA (red double-arrow). Prior to the ZGA a novel isoform is expressed (blue double-arrow). This isoform is expressed also after the MBT but then together with the novel isoform.

References

    1. Kane DA, Kimmel CB. The zebrafish midblastula transition. Development. 1993;119:447–456. - PubMed
    1. Keller PJ, Schmidt AD, Wittbrodt J, Stelzer EH. Reconstruction of zebrafish early embryonic development by scanned light sheet microscopy. Science. 2008;322:1065–1069. - PubMed
    1. Ho RK, Kimmel CB. Commitment of cell fate in the early zebrafish embryo. Science. 1993;261:109–111. - PubMed
    1. Kimmel CB, Ballard WW, Kimmel SR, Ullmann B, Schilling TF. Stages of embryonic development of the zebrafish. Dev Dyn. 1995;203:253–310. - PubMed
    1. Aanes H, Winata CL, Lin CH, Chen JP, Srinivasan KG, Lee SG. et al. Zebrafish mRNA sequencing deciphers novelties in transcriptome dynamics during maternal to zygotic transition. Genome Res. 2011;21:1328–1338. - PMC - PubMed

Publication types

MeSH terms