

Trends in sugar-sweetened beverage consumption among youth and adults in the United States: 1999-2010
- PMID: 23676424
- PMCID: PMC10401613
- DOI: 10.3945/ajcn.112.057943
Trends in sugar-sweetened beverage consumption among youth and adults in the United States: 1999-2010
Abstract
Background: Reducing sugar-sweetened beverage (SSB) consumption is a recommended strategy to promote optimal health.
Objective: The objective was to describe trends in SSB consumption among youth and adults in the United States.
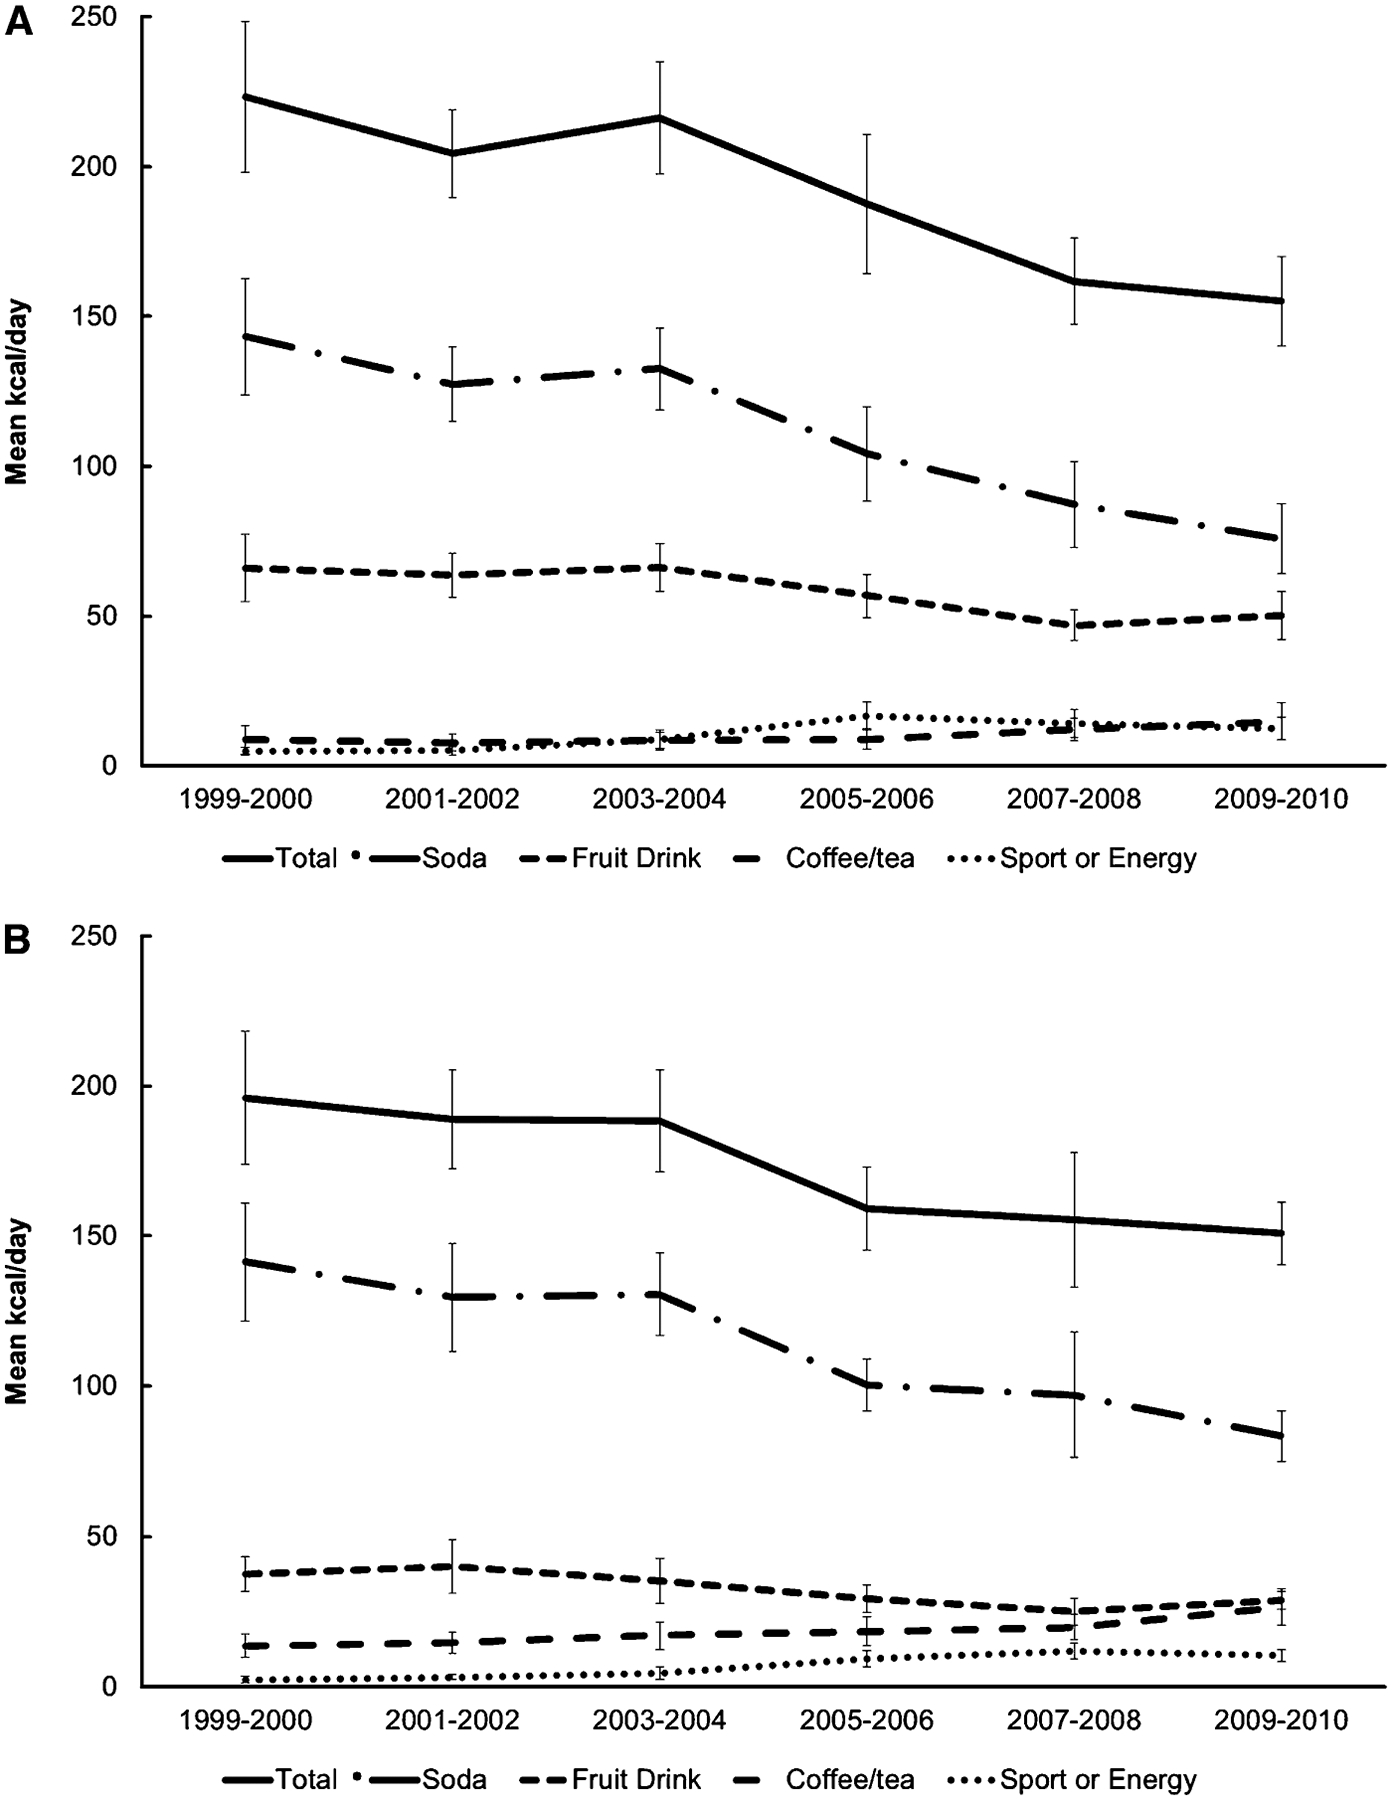
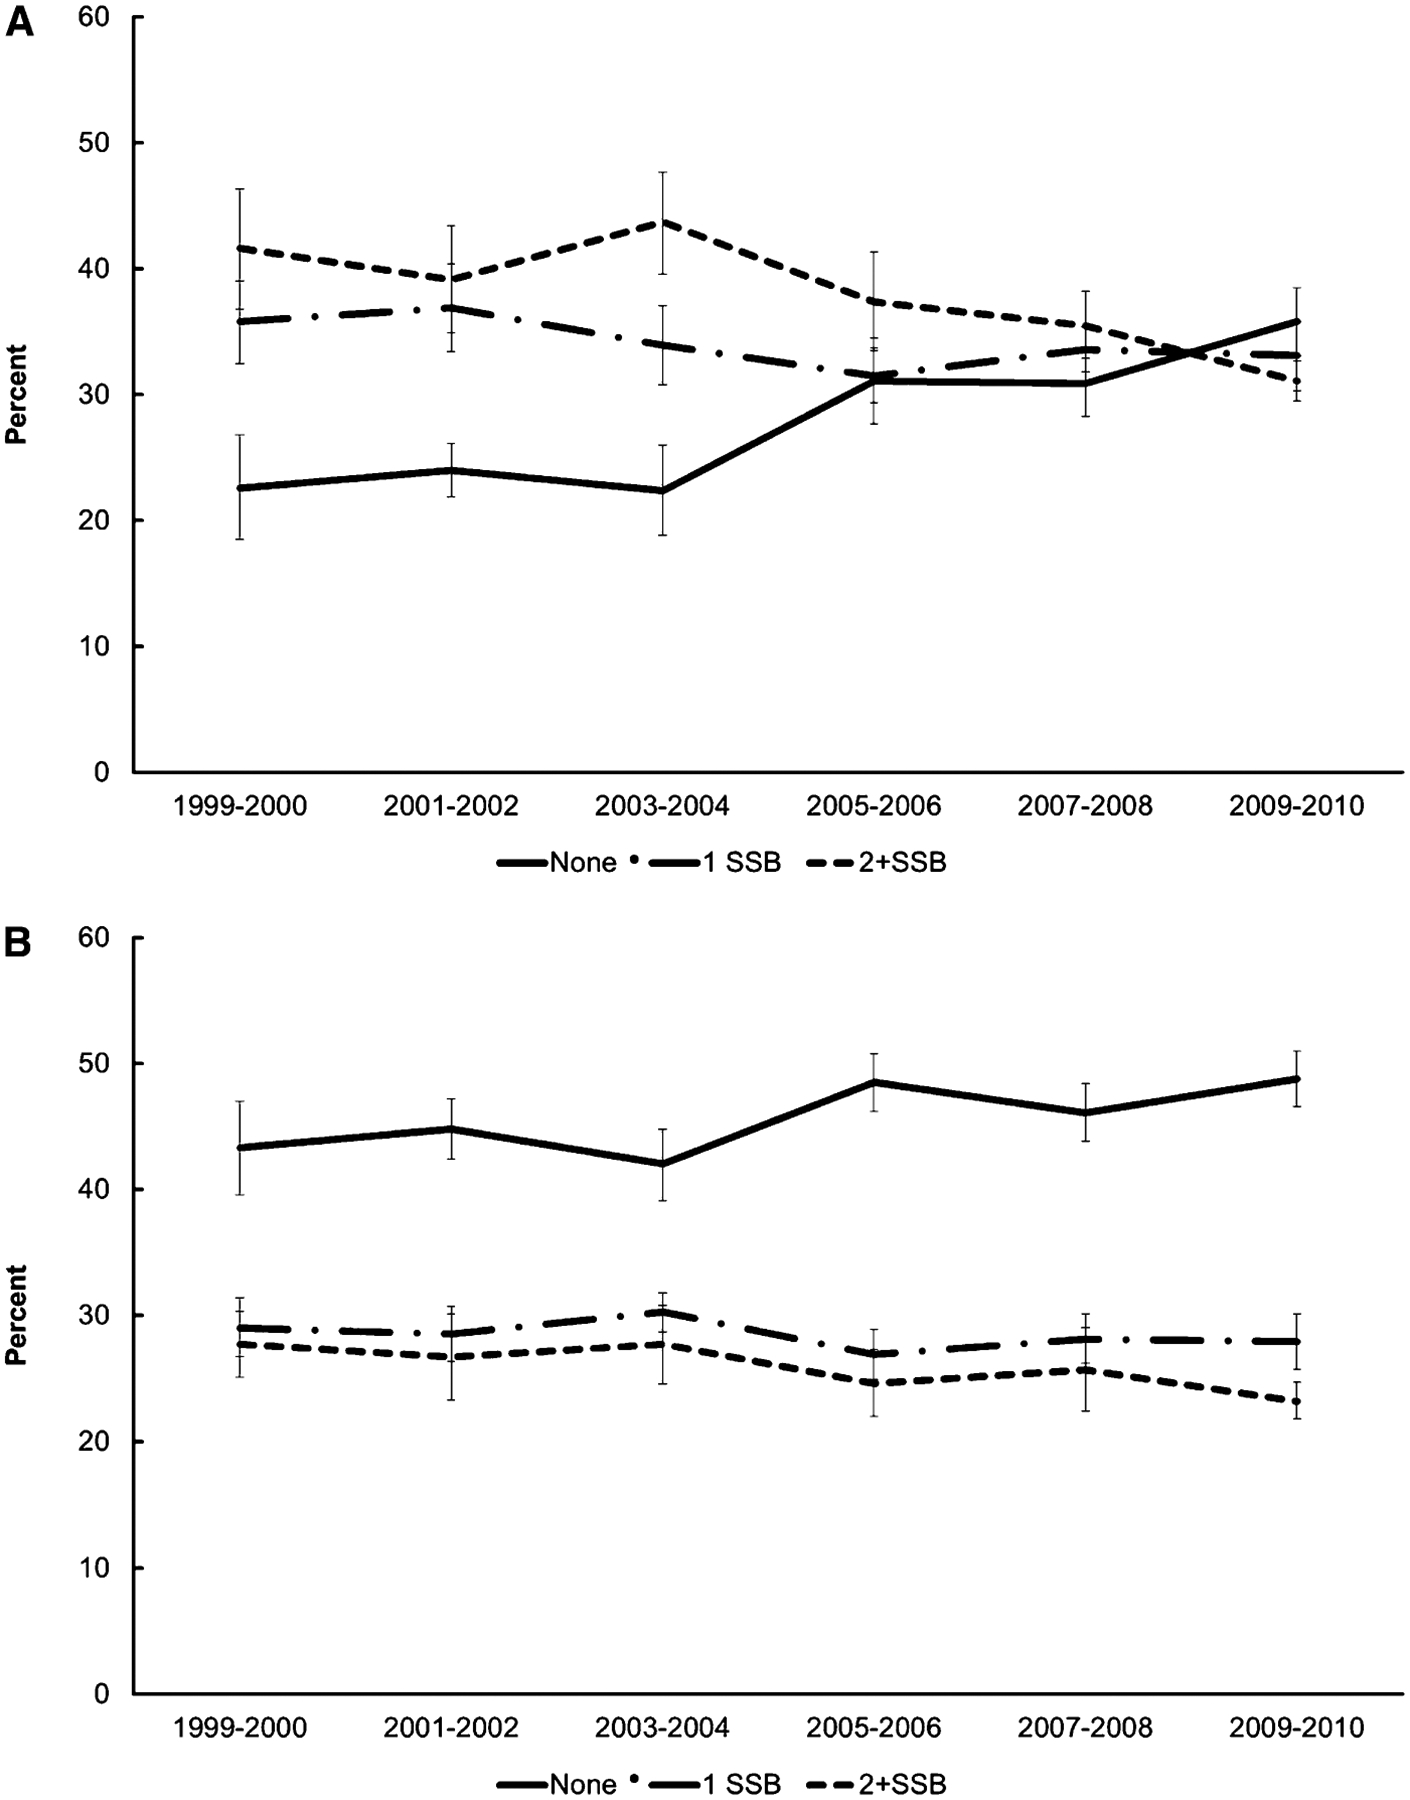
Design: We analyzed energy intake from SSBs among 22,367 youth aged 2-19 y and 29,133 adults aged ≥20 y who participated in a 24-h dietary recall as part of NHANES, a nationally representative sample of the US population with a cross-sectional design, between 1999 and 2010. SSBs included soda, fruit drinks, sports and energy drinks, sweetened coffee and tea, and other sweetened beverages. Patterns of SSB consumption, including location of consumption and meal occasion associated with consumption, were also examined.
Results: In 2009-2010, youth consumed a mean (±SE) of 155 ± 7 kcal/d from SSBs, and adults consumed an age-adjusted mean (±SE) of 151 ± 5 kcal/d from SSBs--a decrease from 1999 to 2000 of 68 kcal/d and 45 kcal/d, respectively (P-trend < 0.001 for each). In 2009-2010, SSBs contributed 8.0% ± 0.4% and 6.9% ± 0.2% of daily energy intake among youth and adults, respectively, which reflected a decrease compared with 1999-2000 (P-trend < 0.001 for both). Decreases in SSB consumption, both in the home and away from home and also with both meals and snacks, occurred over the 12-y study duration (P-trend < 0.01 for each).
Conclusion: A decrease in SSB consumption among youth and adults in the United States was observed between 1999 and 2010.
Conflict of interest statement
The authors’ responsibilities were as follows—BKK and CLO: designed the research; BKK, THIF, SP, SJN, and CLO: analyzed the data and wrote the manuscript; and BKK: had primary responsibility for final content. The authors had no financial relations or conflicts of interest relevant to this article to disclose.
Figures
References
-
- Marshall TA, Levy SM, Broffitt B, Warren JJ, Eichenberger-Gilmore JM, Burns TL, Stumbo PJ. Dental caries and beverage consumption in young children. Pediatrics 2003;112:e184–91. - PubMed
-
- Ismail AI, Burt BA, Eklund SA. The cariogenicity of soft drinks in the United States. J Am Dent Assoc 1984;109:241–5. - PubMed
-
- Heller KE, Burt BA, Eklund SA. Sugared soda consumption and dental caries in the United States. J Dent Res 2001;80:1949–53. - PubMed
MeSH terms
Substances
Grants and funding
LinkOut - more resources
Full Text Sources
Other Literature Sources
